Fishbone Diagram with AI sounds like a small upgrade to an old quality tool. It is not. When you build it inside Jeda.ai, the work stops feeling like diagram assembly and starts feeling like actual diagnosis. That shift matters because a good AI Workspace should help you think, not just decorate a board. In an AI Whiteboard, you want the problem, the cause branches, and the next move to stay in one editable place. Jeda.ai gives you exactly that, and more than 150,000+ users already use Jeda.ai to turn messy thinking into structured visuals. It also sits inside a broader Visual AI workflow with 300+ strategic frameworks, which matters when root cause analysis needs to lead into prioritization, planning, or decision-making.
What is Fishbone Diagram with AI?
A fishbone diagram, also called an Ishikawa diagram or cause-and-effect diagram, is a root cause analysis method that organizes possible causes of a problem into grouped branches. Kaoru Ishikawa developed the first cause-and-effect diagram in 1943 to help workers at Kawasaki Steel Works analyze and understand problems. Later, the method became one of the seven basic quality tools and spread far beyond manufacturing into healthcare, service operations, product work, and project reviews.
What changes when you add AI? Speed, first. But not only speed. A modern fishbone workflow can help teams frame the problem statement, suggest missing cause categories, deepen weak branches, and keep the whole investigation editable after generation. That is where Jeda.ai feels different from a template-only tool. You are not filling a dead file. You are working inside a living AI Workspace that can generate, expand, reorganize, and convert the output as your understanding gets sharper.
A useful detail here: for this Jeda.ai workflow, treat the fishbone as a structured cause map built with the Mindmap command. That gives you the branching logic you need, while still keeping every node editable. Then you can refine the shape so it reads like a fishbone on the canvas.
Why use Fishbone Diagram with AI?
Blank whiteboards are fine until the room goes quiet. Fishbone analysis often stalls for one simple reason: teams know the problem, but they do not know how to structure the causes cleanly enough to see patterns. AI helps break that deadlock.
- Start with structure
Jeda.ai helps you frame the problem, major cause families, and sub-causes without starting from an empty canvas.
- Deepen weak branches
When one branch looks thin, use AI+ to extend it so the analysis gets fuller instead of staying surface-level.
- Keep it editable
Every node stays editable, movable, and reusable, which matters when the first theory turns out to be wrong.
The practical win is not “the diagram appears faster.” The practical win is that your team can spend more of its time arguing over real causes and less of its time debating formatting. ASQ describes the fishbone as a tool for sorting many possible causes into useful categories, especially during brainstorming sessions. AHRQ also points out that cause-and-effect diagrams help teams investigate detrimental effects, identify variation, and even think about prevention. So yes, the old method still holds up. The modern problem is workflow friction. Jeda.ai removes a lot of that friction.
And here is the part people overlook: a fishbone board is rarely the last artifact. A consultant may turn it into a client briefing. A product team may turn it into a fix list. A quality lead may convert it into a corrective action review. In Jeda.ai, that handoff is smoother because the result lives inside an AI Whiteboard and an AI Workspace, not as a frozen screenshot.
You can also connect this analysis to adjacent work. For example, once the cause map is clear, you can move into AI Workspace, review workflows on the AI Whiteboard, or continue with related analysis pages such as Porter’s Five Forces with AI, Gap Analysis with Jeda.ai, and PESTEL Analysis with AI.
How to create Fishbone Diagram with AI in Jeda.ai
This page uses one method only. Open the Prompt Bar, select the Mindmap command, and build the fishbone as a cause-tree that you refine visually after generation. That matches how Jeda.ai handles branching logic best, and it fits your need to keep the output editable.
- Define the effect clearly
Write one sharp problem statement first. Bad fishbones usually fail at the head, not the branches. Use a concrete effect such as 'Product launch delayed by 5 weeks' instead of vague phrasing like 'launch issues'.
- Select Mindmap in the Prompt Bar
Open the Prompt Bar at the bottom of the canvas, choose Mindmap, and use Horizontal layout so the structure reads naturally as a fishbone-style analysis.
- Prompt for cause families and sub-causes
Ask Jeda.ai to generate a fishbone-style mind map with 4 to 6 major categories and 2 to 4 specific causes under each category. Good category examples include People, Process, Tools, Data, Environment, and Policy.
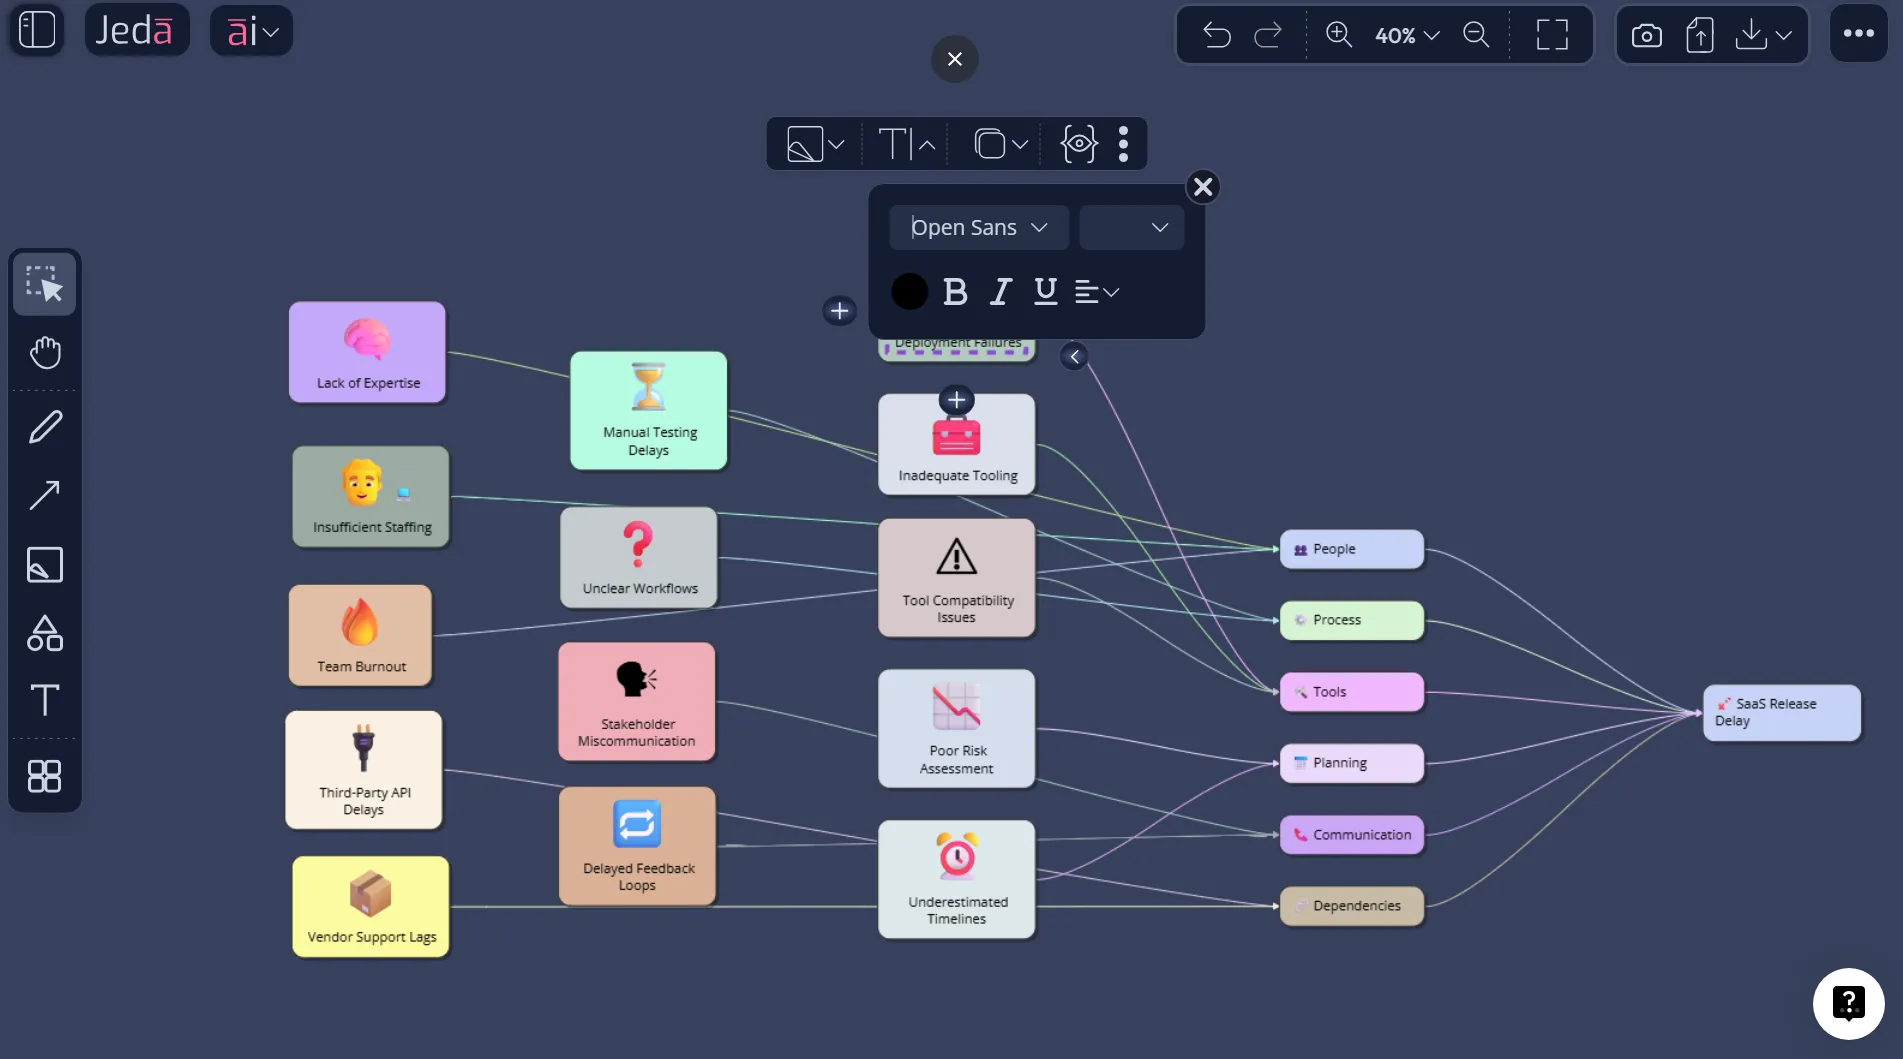
- Edit the board like an investigation
Trim weak causes, rename vague nodes, duplicate branches where needed, and reposition the major cause families so the board visually reads like a fishbone rather than a generic brainstorm.
- Extend and convert when the analysis matures
Use the AI+ button to deepen or extend a branch once the first pass is grounded. Then use Vision Transform if you want to convert the cause map into another view, such as a matrix for prioritization or a flowchart for corrective action.
The prompting part is where most teams either win or waste 20 minutes. Keep the instruction concrete. Ask for a single problem statement, a fixed number of major cause families, and short branch labels. Here is a clean prompt you can use in Jeda.ai:
Prompt example:
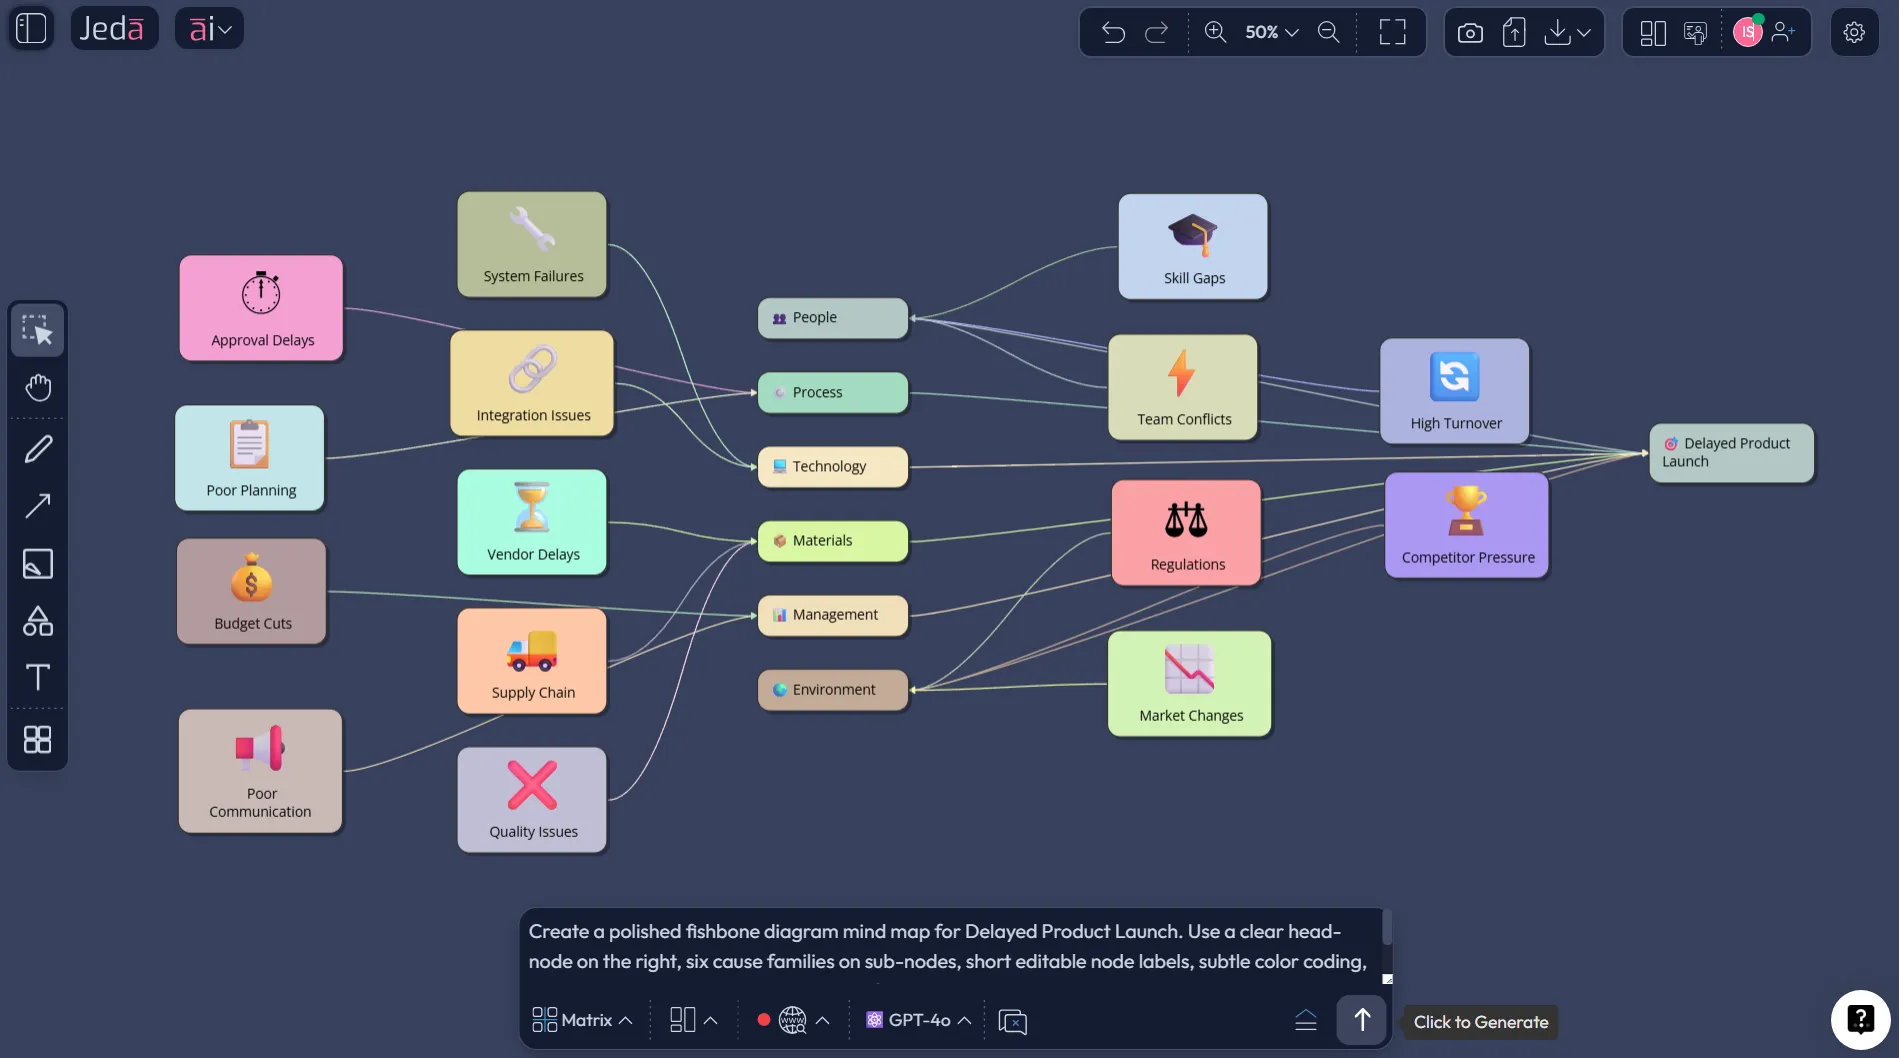
Create a fishbone-style root cause analysis for delayed product launches. Use Mindmap format with a horizontal layout. Put the effect at the far right as the fish head. Create six cause families: People, Process, Tools, Data, Leadership, and Dependencies. Under each family, add three specific, business-relevant causes using short labels. Keep the wording concise and editable.
After generation, refine. This part is not optional. AI can give you a strong first draft, but the real value comes from pushing the board closer to the truth your team already knows. Delete noise. Merge duplicates. Pull vague labels into plain English. Then use the canvas controls to create cleaner sub-branches where the diagnosis needs depth.
A quick caution on AI+: use it to extend or deepen the current branch, not as a magic precision command. In other words, get the first structure right, then ask AI+ to expand the thinking already on the board. That is where it shines. If you ask it to rescue a sloppy problem statement, it will happily build a bigger mess.
Fishbone Diagram with AI template and examples
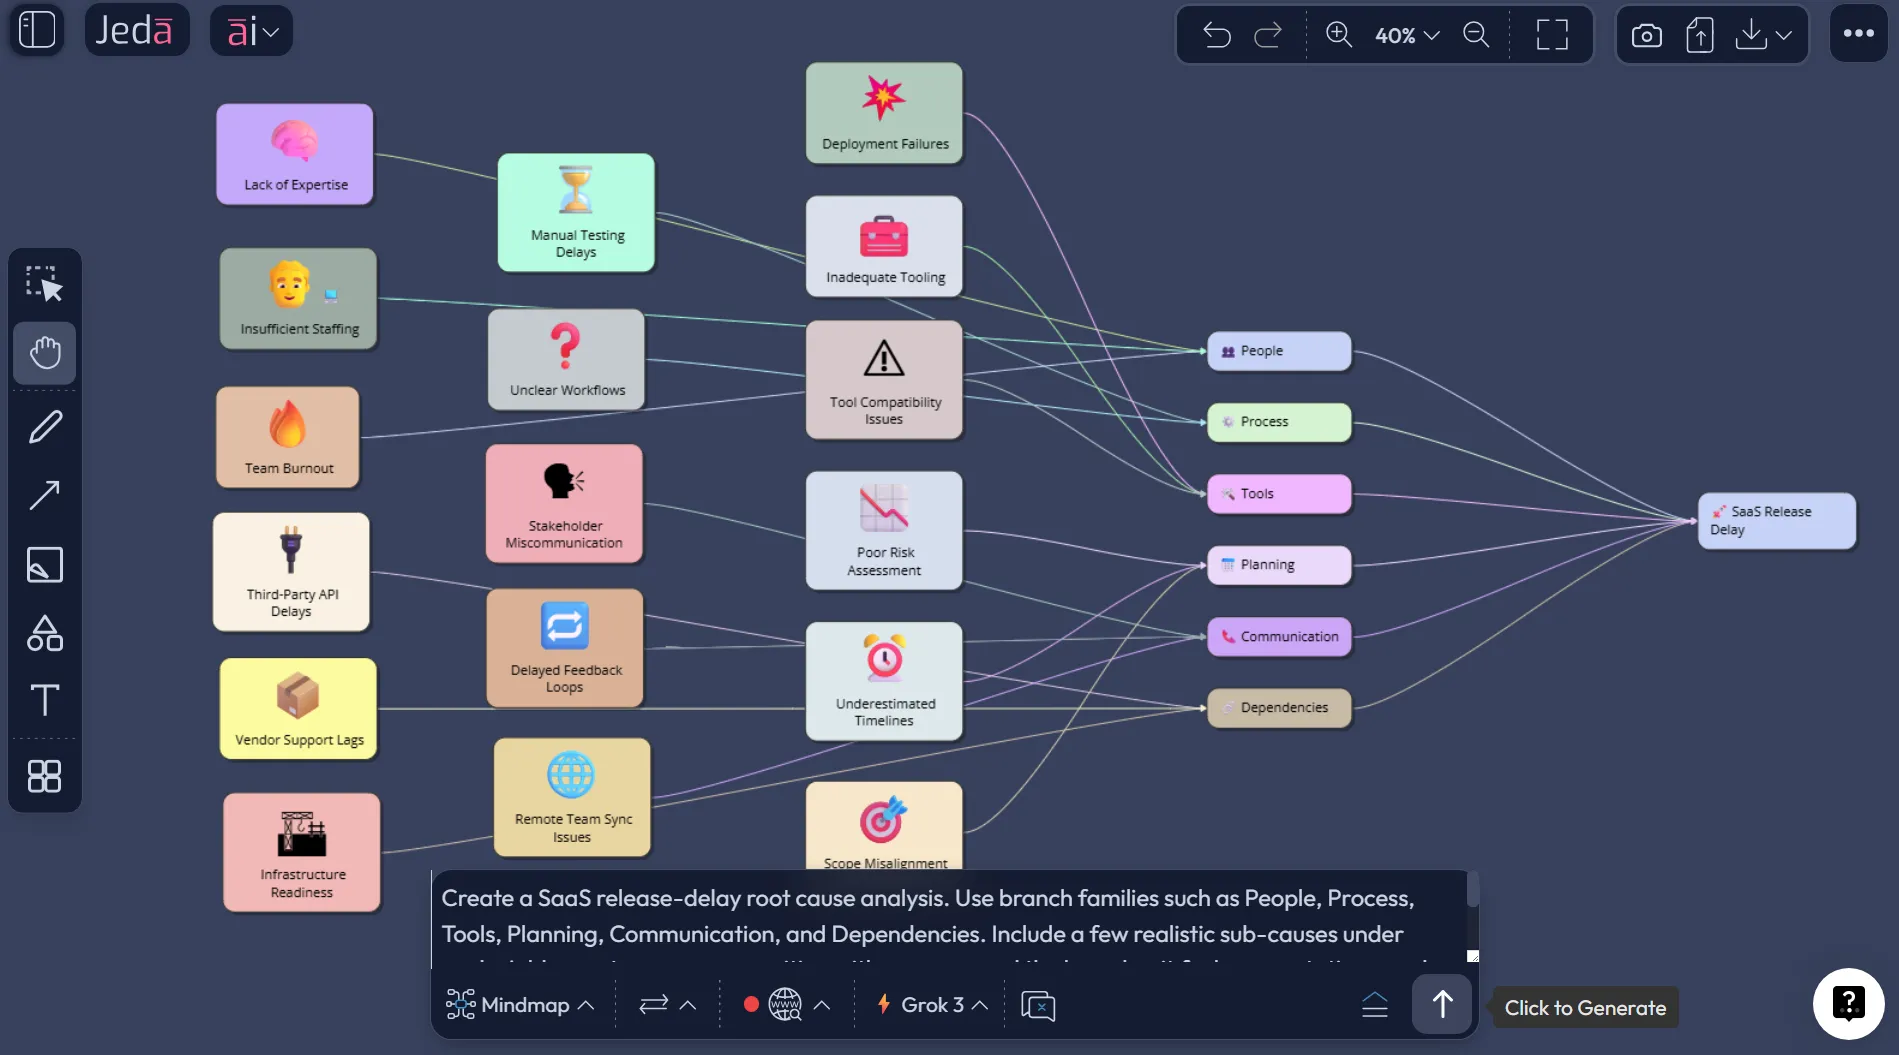
Let’s make this real. Say a SaaS team keeps missing release dates. Everyone has a theory. Engineering says requirements change too late. Product says QA feedback lands late. Leadership says estimation is weak. Support says edge cases keep showing up at the end. Classic.
A fishbone board built in Jeda.ai can hold that mess without flattening it. Put “Release delayed by 5 weeks” in the head. Then branch into People, Process, Tools, Planning, Communication, and External Dependencies. Under People, you might find role ambiguity and overloaded reviewers. Under Process, you may see unclear handoffs and missing definition-of-ready checks. Under Tools, maybe version tracking is split across three systems. Suddenly the room stops arguing in generalities and starts pointing at actual failure points.
This is also where Jeda.ai earns its keep as a working space, not just a generator. You can duplicate the board, test a narrower hypothesis, or turn the same investigation into a corrective action board. Product teams can move from fishbone to prioritization. Consultants can move from diagnosis to recommendation. Business analysts can turn the cause map into a future-state workflow. The output does not die after the meeting.
And because Jeda.ai is an AI Workspace, you are not locked into one view. A fishbone board often answers the question, “What may be causing this?” The next question is usually, “What do we fix first?” That is a different visual. Use Vision Transform when you need it.
Best practices and tips
A fishbone board gets sharper when the team treats it like evidence-led thinking, not a dumping ground.
One more thing. The classic 6M categories from quality work still help, but do not worship them. If you are diagnosing a product onboarding issue, Policy, Journey, or Content may be better categories than Machine or Material. The point is not tradition. The point is useful classification.
Common mistakes to avoid
The first common mistake is writing the head problem too broadly. “Customer experience issues” will produce mush. “Activation drops from 42% to 28% after signup” gives the team something to inspect.
The second is mixing symptoms and causes on the same branch. “High defect rate” might still be an effect, not a cause. Keep asking whether a node explains the problem or merely restates it.
The third is overfilling branches with generic language. A fishbone should make a meeting more precise, not more polite. Replace soft abstractions with specific conditions, behaviors, or constraints.
The fourth is treating the first AI output like the final answer. Do not do that. AI gives you a starting map. Your team still needs to validate, reject, tighten, and sometimes redraw it.
The fifth is ending the session with a pretty diagram and no next move. A fishbone board should feed an action decision, not sit in a folder like an expensive fossil.
Frequently asked questions
- What is Fishbone Diagram with AI?
- Fishbone Diagram with AI is a root cause analysis workflow where AI helps generate, expand, and organize possible causes around a clearly defined problem. In Jeda.ai, you can build it as an editable mind map, then refine it into a fishbone-style investigation board.
- Why use the Mindmap command for a fishbone diagram in Jeda.ai?
- Because the fishbone is fundamentally a branching cause structure. The Mindmap command gives you fast hierarchical generation, editable nodes, and clean branch logic. After generation, you can reposition the structure so it reads visually like a fishbone.
- Is a fishbone diagram the same as a 5 Whys analysis?
- No. A fishbone diagram maps multiple possible causes across categories, while 5 Whys drills down on one causal chain by asking why repeatedly. They work well together. Many teams use fishbone first, then run 5 Whys on the strongest branches.
- How many cause categories should a fishbone diagram have?
- Most teams do best with 4 to 6 major cause families. That is enough to surface patterns without making the board unreadable. If you need 9 or 10 categories, your problem statement is probably too broad and needs to be narrowed.
- Can non-technical teams use Fishbone Diagram with AI?
- Yes. The method works well for service operations, hiring, customer support, marketing execution, product delays, and quality issues. The key is writing a concrete effect statement and using categories that fit the actual context, not forcing manufacturing language onto every problem.
- When should I use AI+ on a fishbone board?
- Use AI+ after the first structure is grounded. It is best for extending or deepening a branch that already makes sense. It is less useful as a rescue tool for a vague problem statement or a messy first draft.
- Can I turn my fishbone board into another format in Jeda.ai?
- Yes. Use Vision Transform when you want to convert the cause map into another visual such as a matrix for prioritization or a flowchart for corrective actions. That is helpful when the team moves from diagnosis into decisions and execution.
- What should a good fishbone prompt include?
- A good prompt names the exact effect, the desired number of major cause categories, the style of branch labels, and the business context. The more concrete the problem statement is, the better the first AI output will be.
- Is Fishbone Diagram with AI useful for consultants and analysts?
- Very much so. Consultants can use it to structure client discovery, analysts can use it to map operational failures, and product teams can use it to diagnose delays or quality issues. The real benefit is faster alignment around causes before recommendations are made.
- Why build this in an AI Workspace instead of a static template?
- A static template helps you draw. An AI Workspace helps you think, revise, and continue. In Jeda.ai, the board stays editable, can be expanded with AI+, and can be transformed into other working visuals without rebuilding the analysis from scratch.
Sources & further reading
- [1]
JUSE (2015) . “Lamenting the Death of Prof. Kaoru Ishikawa” Union of Japanese Scientists and Engineers.
View Source ↗ - [2]
American Society for Quality (2026) . “What Is a Fishbone Diagram? Ishikawa Cause & Effect Diagram” ASQ Quality Resources.
View Source ↗ - [3]
American Society for Quality (2026) . “Seven Basic Quality Tools” ASQ Quality Resources.
View Source ↗ - [4]
Agency for Healthcare Research and Quality (2026) . “Cause-and-Effect Diagram” Digital Healthcare Research.
View Source ↗ - [5]
Kumah, A. (2024) . “Cause-and-Effect (Fishbone) Diagram: A Tool for Generating and Organizing Root Cause Analysis” PubMed Central.
View Source ↗
Start your Fishbone Diagram with AI in Jeda.ai
Join over 150,000 professionals who use Jeda.ai as an AI Workspace and AI Whiteboard for faster, editable root cause analysis.
Try Free Template