BCG Matrix with AI is a practical way to classify products or business units without spending half a day rebuilding the same 2×2 grid. In an AI Workspace, you can generate the matrix structure, attach your evidence, and produce a portfolio view that your team can edit together on an AI Whiteboard—fast enough to be useful, disciplined enough to defend.
What is the BCG (Boston Consulting Group) Matrix?
The BCG Matrix—often called the Growth-Share Matrix—is a portfolio management framework created at Boston Consulting Group to help organizations allocate resources across products or business units. It sorts items into four quadrants using market growth rate (a proxy for market attractiveness) and relative market share (a proxy for competitive position).
The quadrants are:
- Stars: high growth, high relative share
- Cash Cows: low growth, high relative share
- Question Marks: high growth, low relative share
- Dogs (sometimes called “pets” in older BCG materials): low growth, low relative share
Although the matrix is simple, its logic rests on a deeper idea: the cash demands of growth differ from the cash generation associated with scale advantages (often discussed alongside experience curve effects).
Why use the BCG Matrix with AI?
Using the BCG Matrix with AI changes the bottleneck. The bottleneck stops being “drawing the matrix,” and becomes “choosing good assumptions.”
In an AI Workspace like Jeda.ai, the AI helps you:
- Draft the matrix layout instantly on an AI Whiteboard
- Keep your assumptions visible (growth definition, share denominator, market boundaries)
- Turn quadrant placement into actions (invest, maintain, harvest, divest) while the team edits together
- Cross-check reasoning by running multiple LLMs (via the Multi-LLM Agent) and selecting the strongest synthesis
- Faster structure, same rigor
You get the correct quadrant scaffolding in seconds, then spend your time on definitions, segmentation, and thresholds—the parts that actually drive validity.
- Portfolio thinking becomes collaborative
A BCG matrix is a group artifact. Jeda.ai’s AI Whiteboard editing makes it easier to align finance, product, and strategy teams on one shared portfolio view.
- Evidence-in, not vibes-in
Bring in docs or spreadsheets, extract the relevant market notes, and keep the rationale attached to each quadrant decision.
How to create a BCG Matrix in Jeda.ai
This section shows two valid workflows. Method 1 uses the AI Menu (Recipe Matrix). Method 2 uses the Prompt Bar (Matrix command). The output stays editable because Matrix is an editable command type.
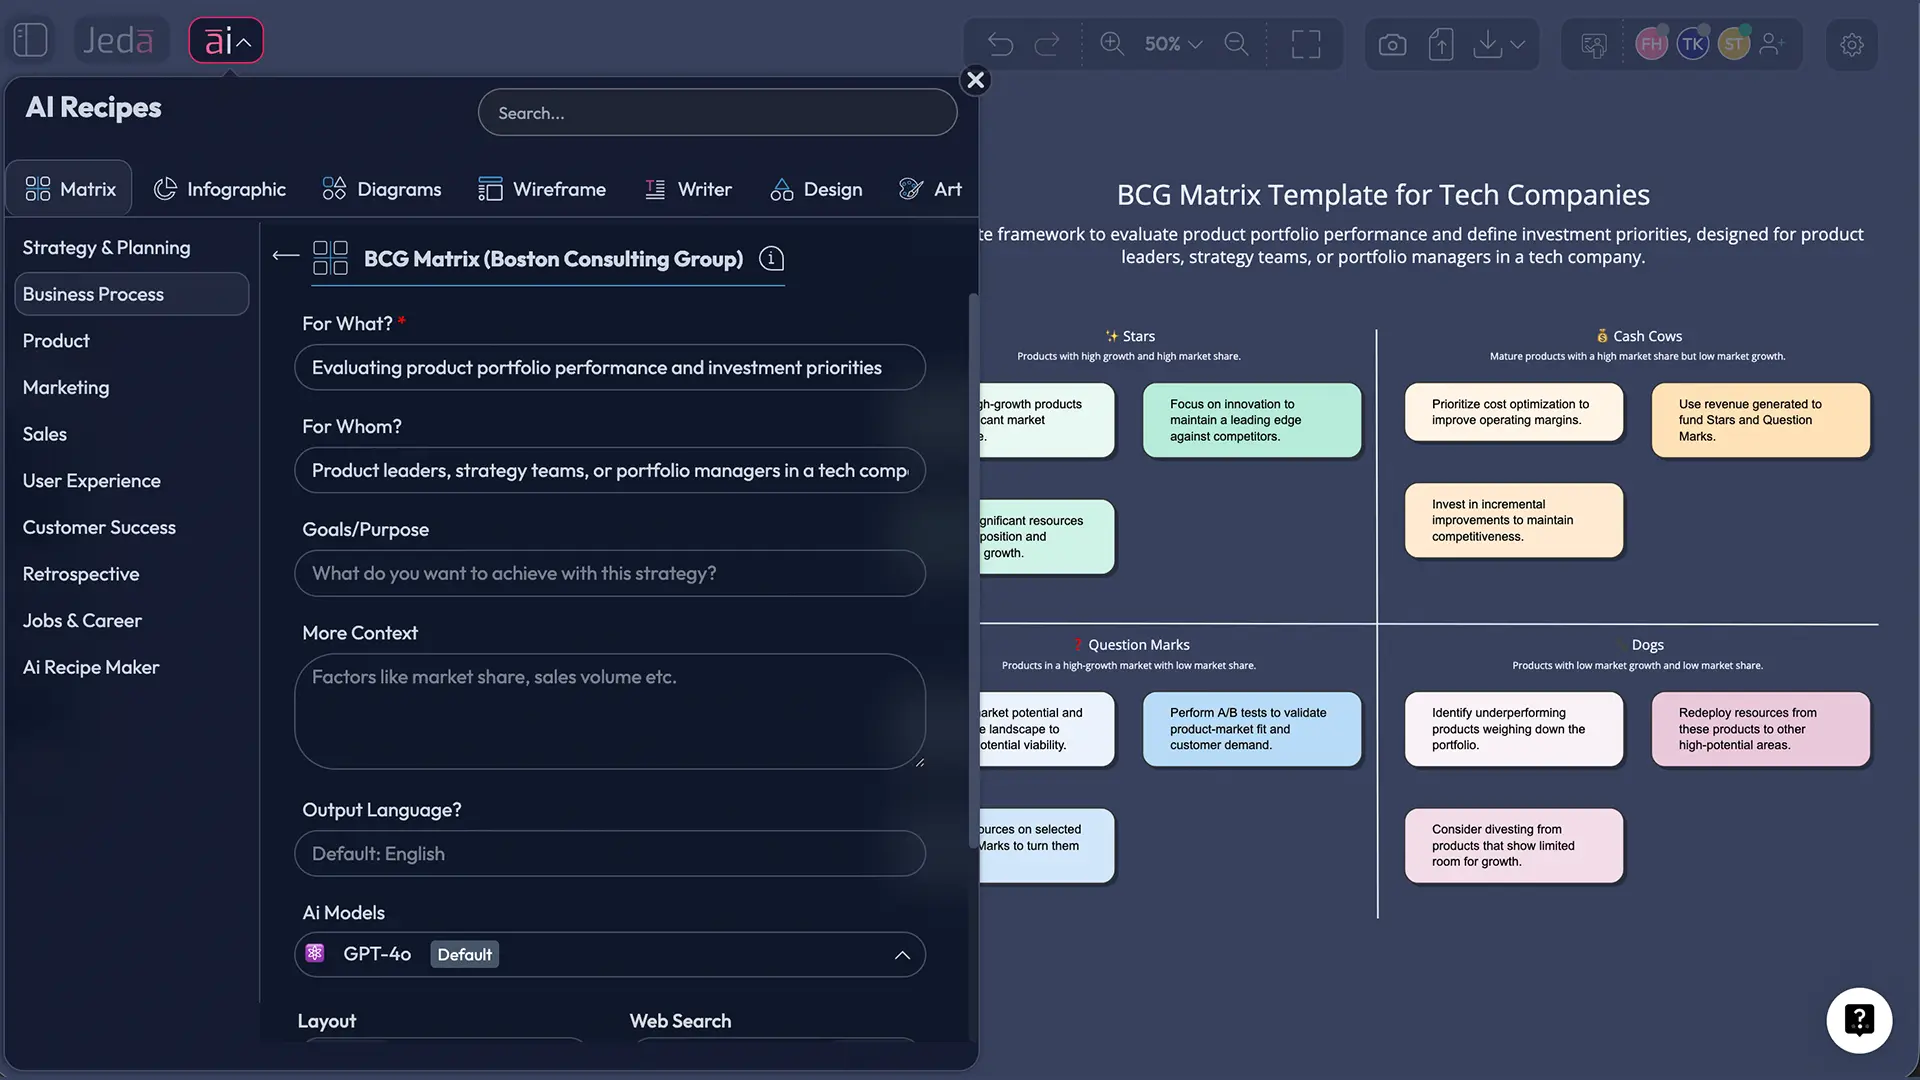
Method 1 — Recipe Matrix (AI Menu)
Use this method when you want a consistent BCG layout with clean quadrant labels and visual structure.
- Open the AI Menu
On the canvas, click the AI Menu in the top-left. This is where Jeda.ai’s recipe library lives.
- Choose Matrix Recipes
Select the Matrix Recipes category. If you see a BCG / Growth-Share Matrix recipe, pick it.
- Enter portfolio context
Add the business units or products you are evaluating, plus how you define the market and the time window for growth (e.g., 12–24 months).
- Generate and edit the matrix
Click Generate. Then adjust quadrant thresholds, move items, and add short evidence notes to each item.
- Extend with AI using the AI+ button
Select a quadrant (or a specific item) and use the AI+ button to extend the board with additional depth, while keeping the output consistent with your existing content.
- Export for sharing
Export the board as PNG, SVG, or PDF depending on where you’ll share it.
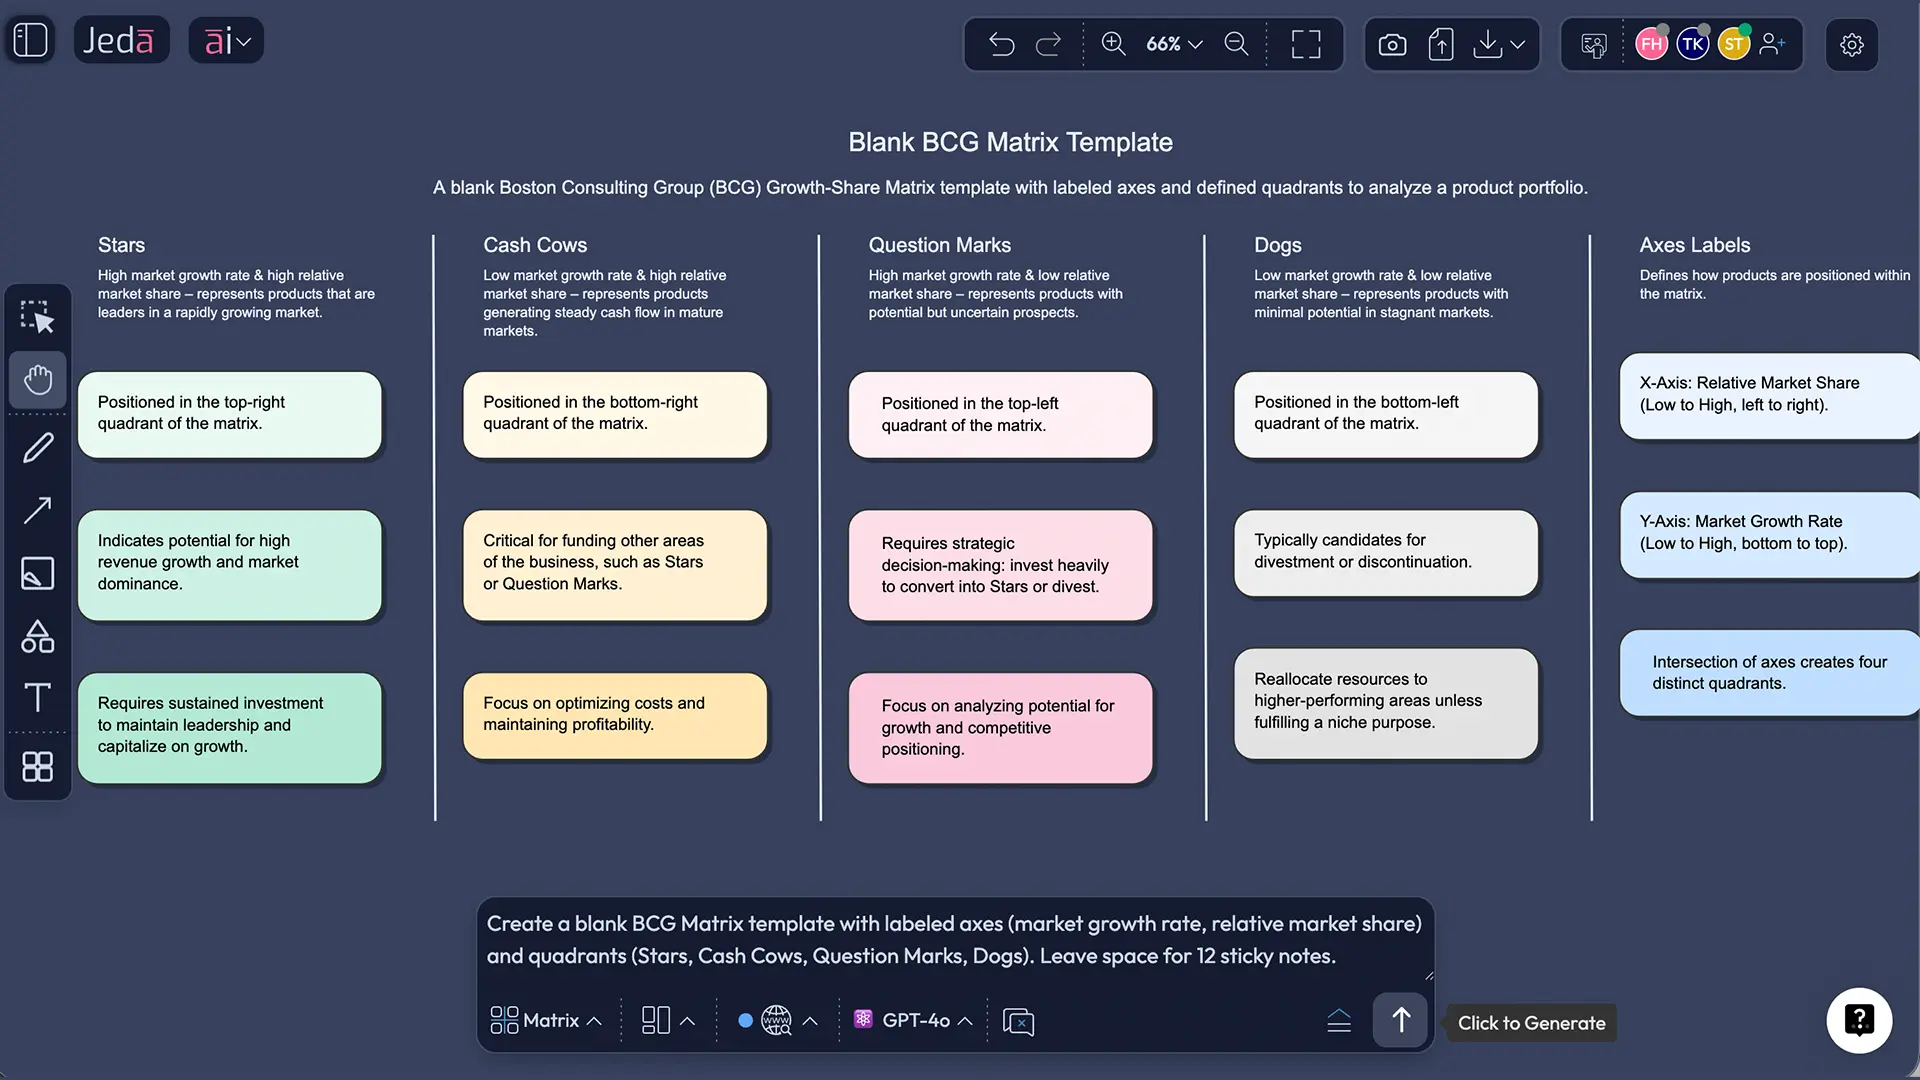
Method 2 — Prompt Bar (Matrix command)
Use this method when you want a custom matrix definition (your thresholds, your market segmentation logic, your labels).
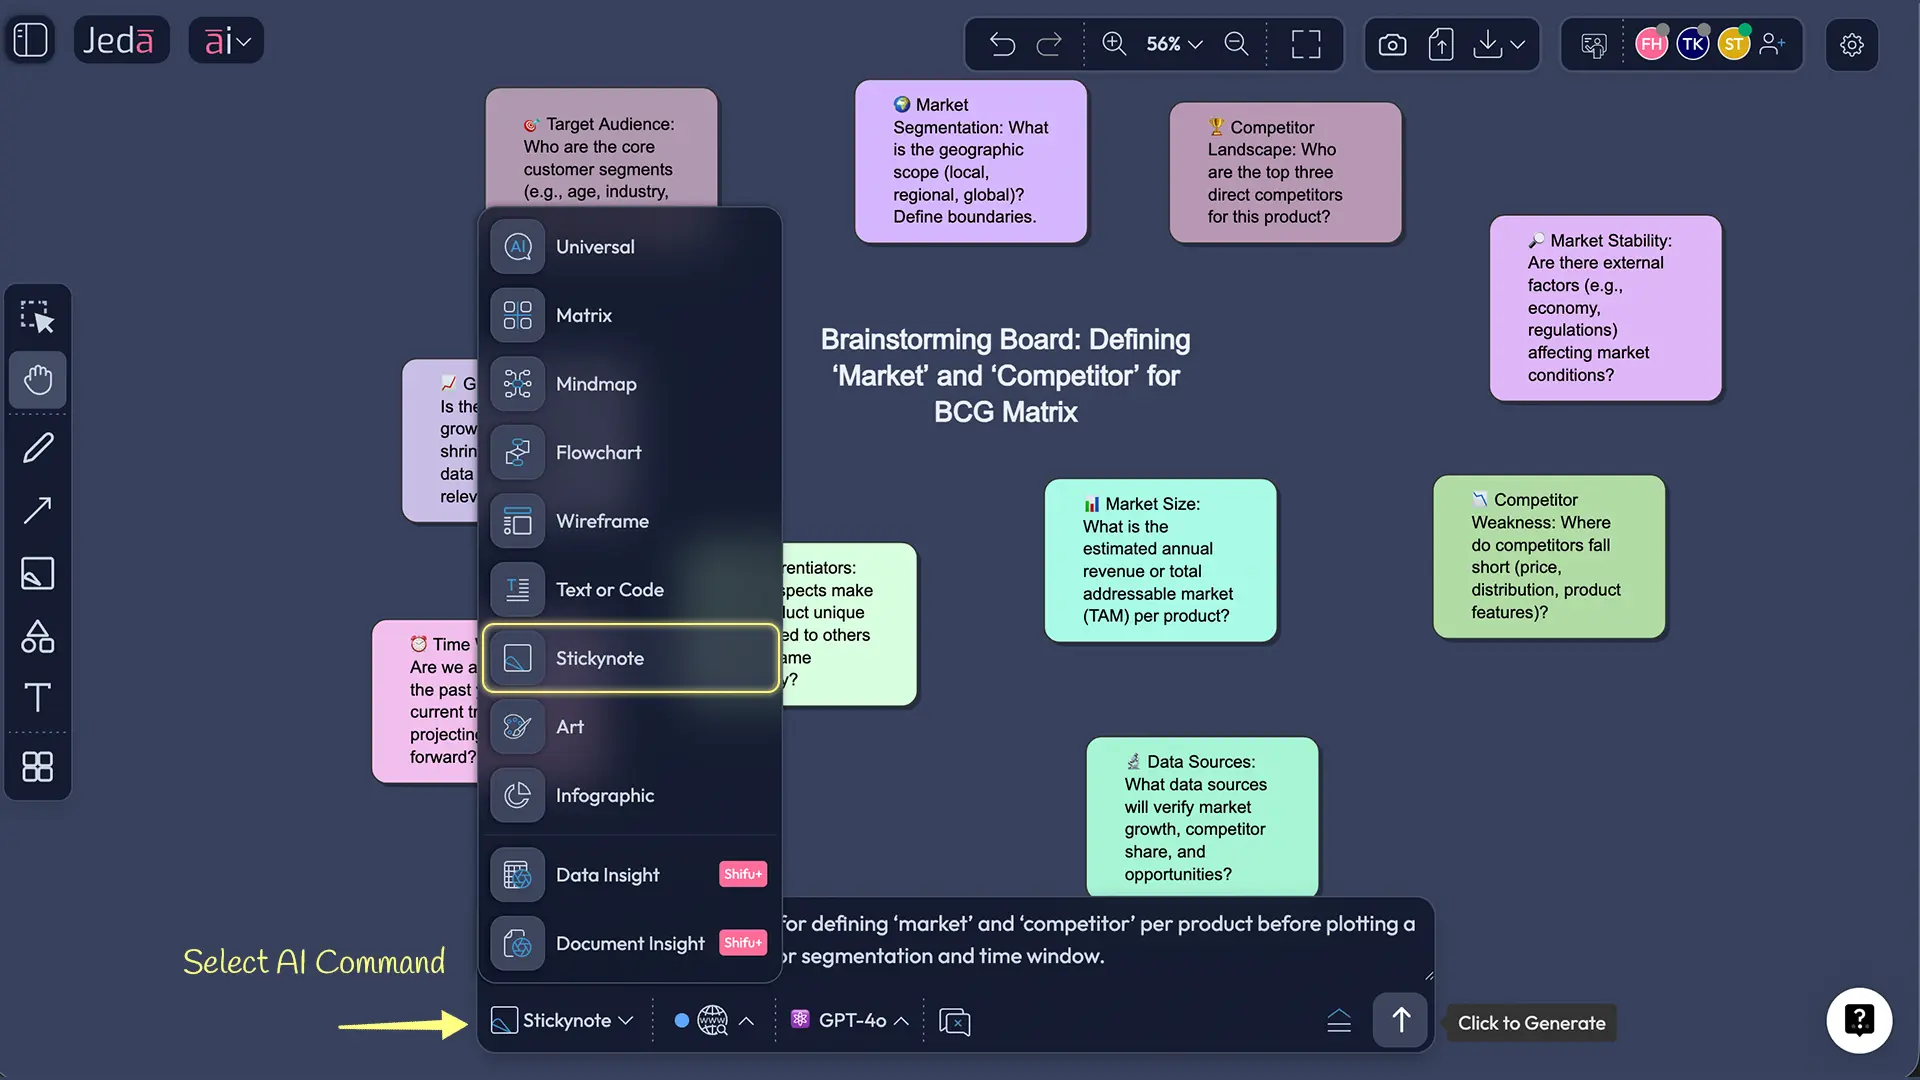
- Open the Prompt Bar at the bottom of the canvas.
- Select the Matrix command.
- Paste a prompt like this and press Enter:
Prompt (copy/paste):
“Create a BCG (Boston Consulting Group) Growth-Share Matrix for the following portfolio.
Define the vertical axis as market growth rate over the last 12 months (high vs low), and the horizontal axis as relative market share vs the largest competitor (high vs low).
Quadrants: Stars, Cash Cows, Question Marks, Dogs.
Portfolio items: [list items].
For each item, add: assumed market definition, growth rate estimate, relative market share estimate, and one sentence of rationale.
Then propose a recommended action per item (invest, maintain, harvest, divest) and a key risk to validate.”
AI+ deep dive (keep it generic)
After your first pass, you often notice “soft spots”: vague markets, fuzzy competitors, or items that sit on the boundary. That’s normal.
Use AI+ as an extension tool: select an existing quadrant or item, tap AI+, and ask the AI to extend what is already on the board. Keep your board as the source of truth; AI is there to help you expand and refine, not replace your assumptions.
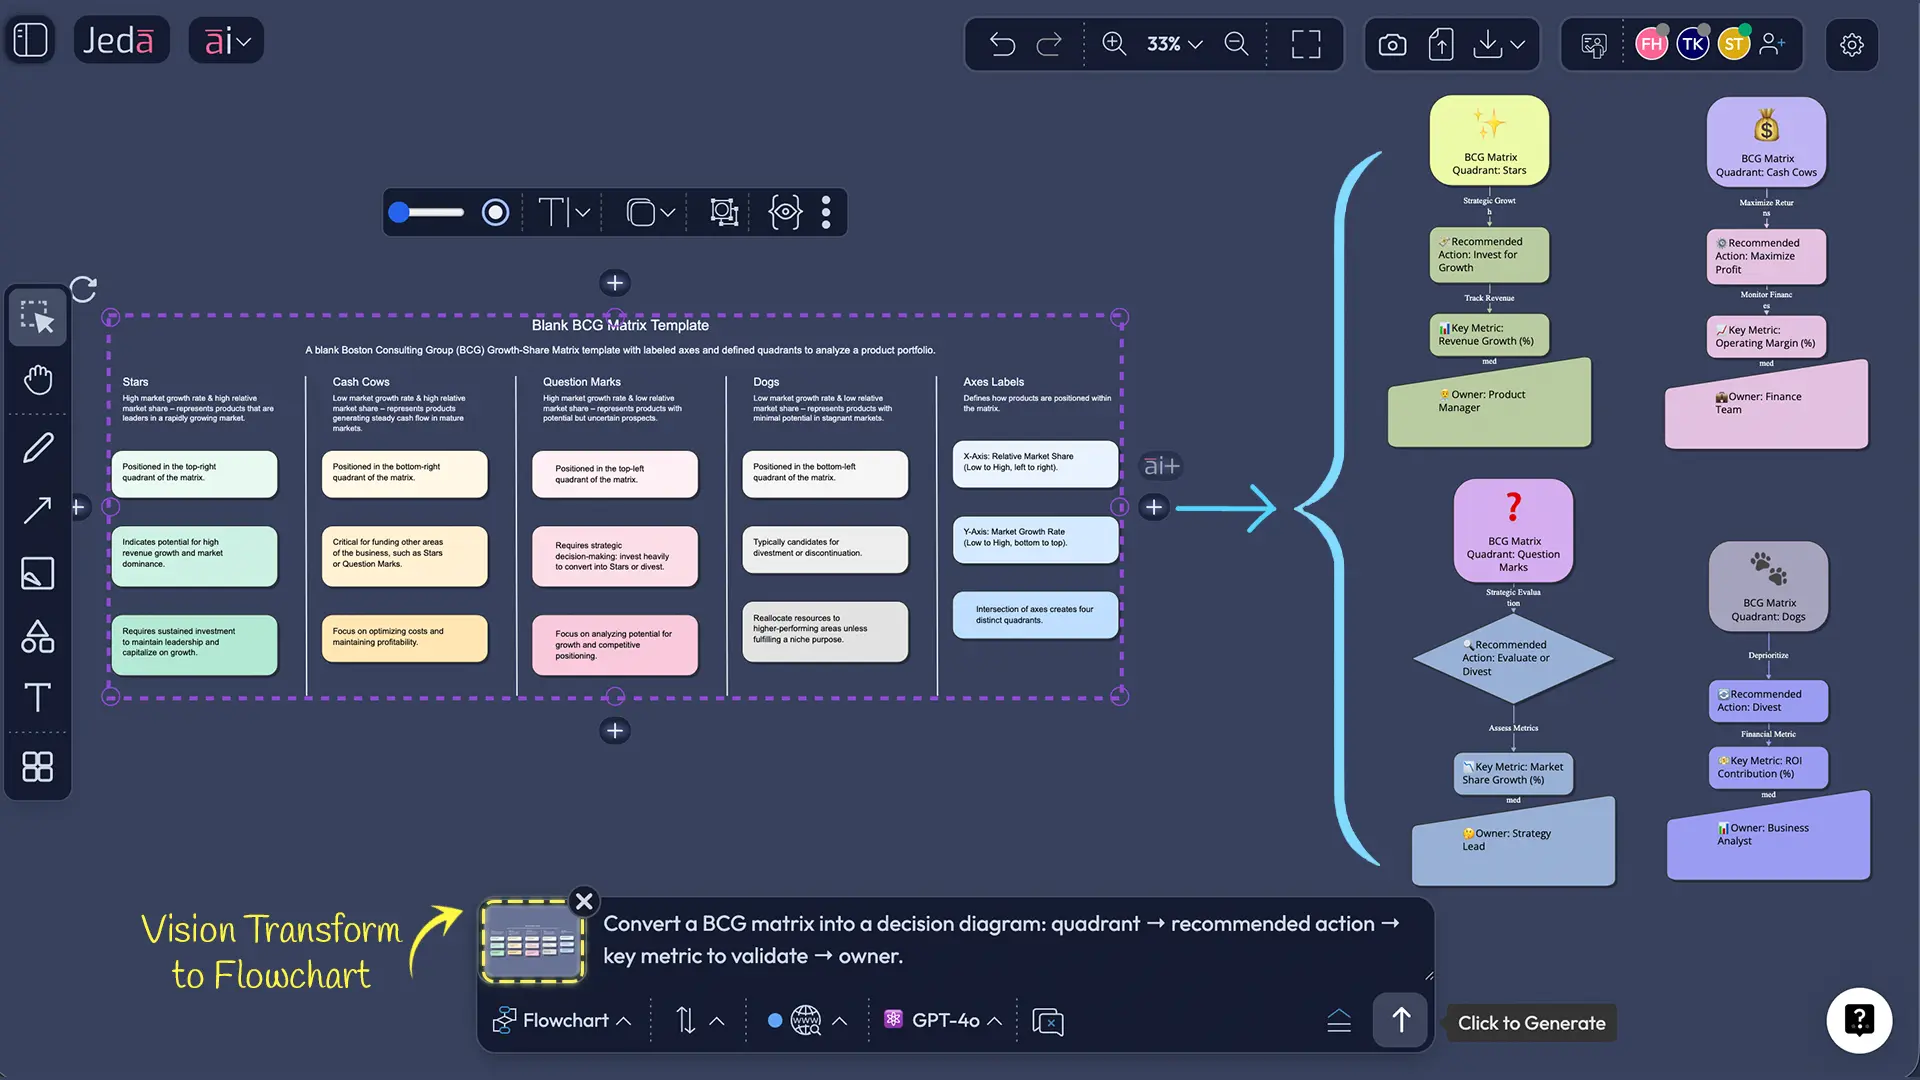
Vision Transform (matrix → diagram or flowchart)
Once the matrix is stable, it’s useful to convert the quadrant logic into an execution path (who does what next). Use Vision Transform to convert a matrix into a diagram or flowchart without rebuilding from scratch.
BCG Matrix template (data fields + thresholds)
A BCG Matrix becomes more defensible when each plotted item carries the same minimum data.
Data fields per product / SBU:
- Market definition (what market, what geography, what segment)
- Time window (e.g., last 12 months growth)
- Market growth rate (%)
- Your market share (%)
- Largest competitor share (%)
- Relative market share = (your share ÷ largest competitor share)
- Cash profile note (cash generated vs cash required)
- Decision recommendation + one measurable next step
Threshold guidance (not universal):
- Growth “high vs low” is often set relative to your portfolio median, or a category benchmark.
- Share “high vs low” is often anchored at relative share = 1.0 (you’re the leader if >1).
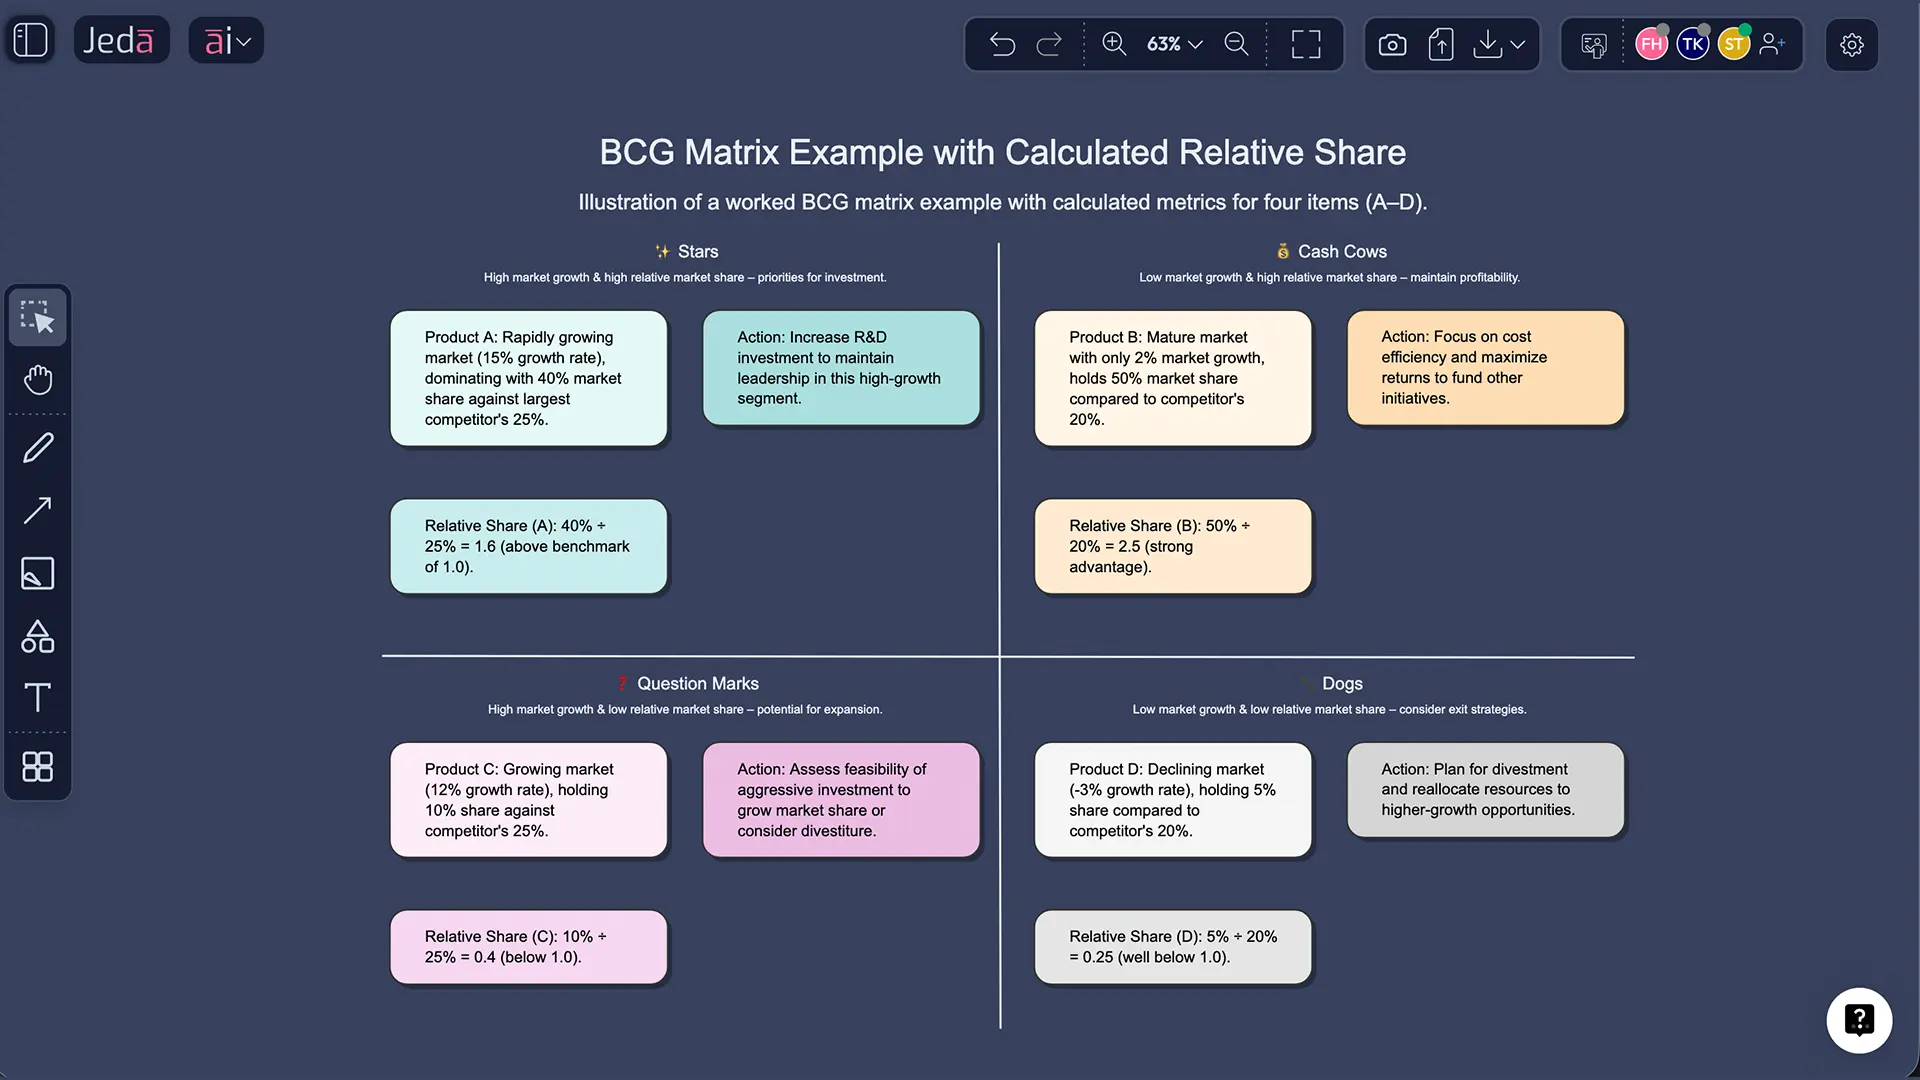
Worked example (portfolio classification, step-by-step)
Consider a company with four offerings. The numbers below are illustrative, used to show the mechanics.
| Item | Market growth | Your share | Largest competitor share | Relative share | Likely quadrant |
|---|---|---|---|---|---|
| A | 18% | 28% | 20% | 1.40 | Star |
| B | 3% | 35% | 30% | 1.17 | Cash Cow |
| C | 22% | 6% | 24% | 0.25 | Question Mark |
| D | 1% | 4% | 18% | 0.22 | Dog |
Now the strategic question is not “what’s the label?” It’s “what’s the move?”
Best practices (what improves validity)
Segment before you plot.
Henderson warned that segmentation choices can distort the matrix. If the “market” is defined too broadly, you may look like a leader while being weak in every important segment.Write the assumptions on the board.
Portfolio tools fail in practice when people forget what “growth” and “share” meant during the workshop. This is exactly where an AI Workspace helps: the assumptions live next to the matrix.Use the matrix as a conversation starter, not a verdict.
Academic and practitioner literature both point out limits: two variables can’t capture synergy, strategic options, regulation, switching costs, or platform dynamics.Revisit on a cadence.
Portfolios move. Set a review rhythm (quarterly for volatile categories; semiannual for mature ones). Keep the prior matrix visible so you can see drift.
Common mistakes to avoid
Treating market growth as “your sales growth.”
Those are different. The axis is market growth, not internal performance.Using relative share without naming the competitor.
Relative share is meaningless unless everyone agrees who “largest competitor” is for that market definition.Plotting everything at once with mixed market definitions.
A portfolio built from incompatible market definitions is tidy but wrong.Assuming Dogs must be killed immediately.
The “Dog” category can include strategically useful niches. The question is: what’s the role, and what’s the exit condition?Ignoring time.
The matrix is a snapshot. It becomes more valuable when you track movement (Question Mark → Star → Cash Cow).
Frequently Asked Questions
- What is the BCG (Growth-Share) matrix?
- The BCG matrix is a portfolio framework that classifies products or business units using market growth rate and relative market share. It helps you decide where to invest, maintain, harvest, or divest by mapping items into Stars, Cash Cows, Question Marks, and Dogs.
- How do you calculate relative market share in the BCG matrix?
- Relative market share is typically calculated as your market share divided by the market share of the largest competitor in the same defined market. A value above 1.0 means you lead that market; below 1.0 means a competitor leads.
- What data do I need to build a BCG matrix?
- You need a clear market definition per item, a market growth rate over a stated time window, your market share, and the largest competitor’s market share. Adding a short cash profile note and a decision recommendation makes the matrix easier to use.
- What do Stars, Cash Cows, Question Marks, and Dogs mean?
- Stars are high-growth leaders that often need investment; Cash Cows are low-growth leaders that generate surplus cash; Question Marks are high-growth challengers that require a decision to invest or exit; Dogs are low-growth, low-share positions that need a clear strategic role or exit plan.
- When should you use a BCG matrix?
- Use it when you manage a portfolio of products or business units and need an explicit resource allocation conversation. It works best when you can define markets cleanly and estimate growth and shares with reasonable confidence.
- What are the limitations of the BCG matrix?
- Its two-axis structure can’t capture synergy, regulation, switching costs, or strategic options, and results depend heavily on how you define the market and competitors. Treat it as a disciplined starting point, not the final answer.
- How is the BCG matrix different from the GE/McKinsey matrix?
- The BCG matrix uses market growth and relative market share. The GE/McKinsey matrix expands the logic into multiple factors by modeling industry attractiveness and competitive strength, which can better reflect complex markets.
- Can startups use the BCG matrix?
- Yes, but carefully. Startups often lack stable share data and operate in shifting market definitions, so the matrix should be treated as a hypothesis tool. It’s most useful when combined with clear assumptions and frequent updates.
- How do you make a BCG Matrix with AI in Jeda.ai?
- You can generate it using Method 1 (AI Menu → Matrix Recipes) or Method 2 (Prompt Bar → Matrix command). After generating, edit quadrant thresholds, attach evidence notes, and use AI+ to extend existing parts of the board for deeper detail.
- How often should a BCG matrix be updated?
- Update it on a cadence that matches market volatility—often quarterly for fast-moving categories and semiannually for mature categories. The value increases when you track quadrant movement over time.
Sources & further reading
- [1]
Boston Consulting Group (BCG) (n.d.) . “What Is the Growth Share Matrix?” BCG (Our History).
View Source ↗ - [2]
Reeves, M., Moose, S., & Venema, T. (2014) . “BCG Classics Revisited: The Growth-Share Matrix” Boston Consulting Group.
View Source ↗ - [3]
Haspeslagh, P. (1982) . “Uses and Limits” Harvard Business Review.
View Source ↗ - [4]
Cooper, R. G., Edgett, S. J., & Kleinschmidt, E. J. (2012) . “Corporate Portfolio Management for New Product Development: Results of an Industry Practices Study” R&D Management.
View Source ↗ - [5]
Henderson, B. D. (1973) . “The Experience Curve—Reviewed IV: The Growth Share Matrix” Boston Consulting Group (PDF copy).
View Source ↗ - [6]
Hanlon, A. (2022) . “How to use the BCG Matrix model” Smart Insights.
View Source ↗
Start Your BCG Matrix with AI Today
Join over 150,000+ users who use Jeda.ai as an AI Workspace and AI Whiteboard for decision-ready strategy visuals.
Try Free Template