Fault Tree Analysis with AI gets interesting the moment it stops being a slow symbol-drawing exercise and becomes a live thinking process. That is the real shift. Instead of building failure logic branch by branch from scratch, you can use Jeda.ai to generate a first-pass structure, refine it on an AI Workspace, and collaborate on the same AI Whiteboard until the logic actually holds up. For engineers, analysts, and consultants, that means less blank-canvas time and more time pressure-testing what could go wrong before it does. Jeda.ai already supports 150,000+ users across visual workflows, so this is not some lab demo pretending to be a product. And yes, that matters a lot when the “top event” is expensive, unsafe, or reputation-killing.
What is Fault Tree Analysis?
Fault tree analysis is a top-down, deductive method for analyzing how an undesired event can happen. You start with the failure you care about most, often called the top event, and then work downward through contributing failures, conditions, and logic gates until you reach basic events you can inspect, quantify, or act on. NIST describes it as a Boolean-logic-based failure analysis, while long-standing NASA and NRC references show how deeply it is embedded in safety and reliability work.
That history matters because fault trees were never just drawing exercises. They were built to answer a harder question: what combinations of failures make this bad outcome possible at all? In practice, that is why fault tree analysis still shows up in aerospace, nuclear safety, industrial systems, cybersecurity, and other high-consequence environments. It gives teams a structured way to expose hidden dependency chains instead of chasing the loudest symptom in the room.
Most ranking pages today still treat fault trees as either a manual template or a static teaching diagram. Useful, sure. But incomplete. Jeda.ai takes the method into a more practical place: you can generate a strong draft visually, edit every node, expand branches with the AI+ button, and turn the output into a shared working board instead of a dead-end diagram.
Why use Fault Tree Analysis with AI?
Here is the blunt truth. The hard part of fault tree work is rarely the notation. It is choosing the right top event, decomposing causes at the right level, and spotting combinations you would otherwise miss. AI helps most at that front end. It accelerates the first draft, suggests plausible branch structures, and makes it easier to explore alternatives before the team starts debating details.
Jeda.ai is useful here because the output is not trapped in chat. It lands as an editable visual on the canvas. That means your fault tree can be reviewed, corrected, extended, color-coded, and repurposed without rebuilding it in another tool. On the same AI Workspace, you can move from draft logic to team review to action planning. No tool hopping. No messy handoff.
And this is where the gap in the market gets obvious. Many current tool pages offer templates, diagram editors, or how-to guides. Fewer offer a guided Diagram recipe, live web-grounding when current context matters, multiple model choices, and editable Smart Shape outputs on a collaborative AI Whiteboard. That combination is the advantage.
- Faster first draft
Generate a usable branch structure in minutes instead of manually placing every event and gate from scratch.
- Sharper failure logic
Test whether the top event truly depends on the causes you listed, then refine weak branches before they mislead the team.
- Real collaboration
Review, edit, and extend the tree on one shared canvas so the analysis stays visible, editable, and actionable.
There is also a strategic upside. Jeda.ai already frames work inside a Visual AI environment with 300+ strategic frameworks and diagram recipes, so fault trees do not have to live alone. You can start with a fault tree, use AI+ to deepen a fragile branch, and then convert the output with Vision Transform if you want a flowchart, mind map, or adjacent analysis view. That is much closer to how real teams think.
How do you create Fault Tree Analysis with AI in Jeda.ai?
If you want the cleanest path, start with the Diagram recipe. That is the main method for this page because Fault Tree already exists inside Jeda.ai’s Diagram Recipes. The guided setup helps you define the problem before the visual appears, which is exactly where many fault trees get sloppy.
Method 1: Use the Diagram Recipe for Fault Tree
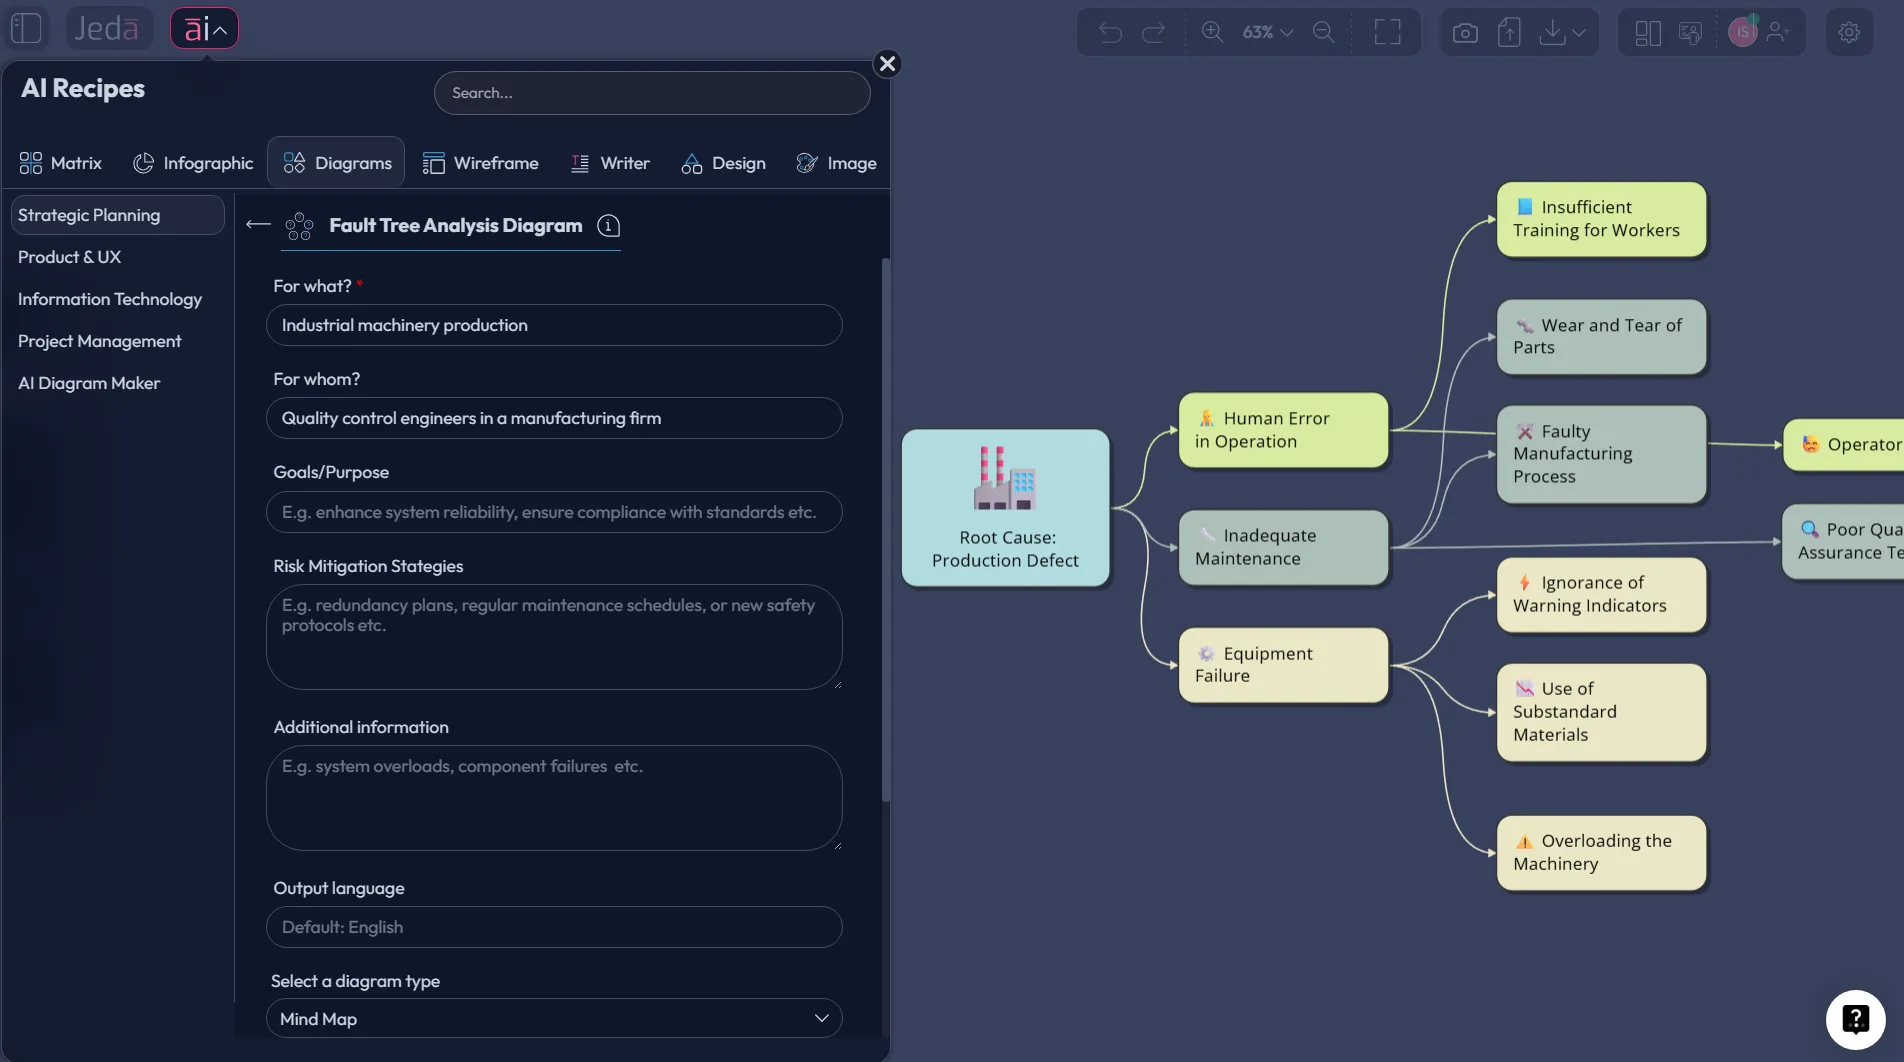
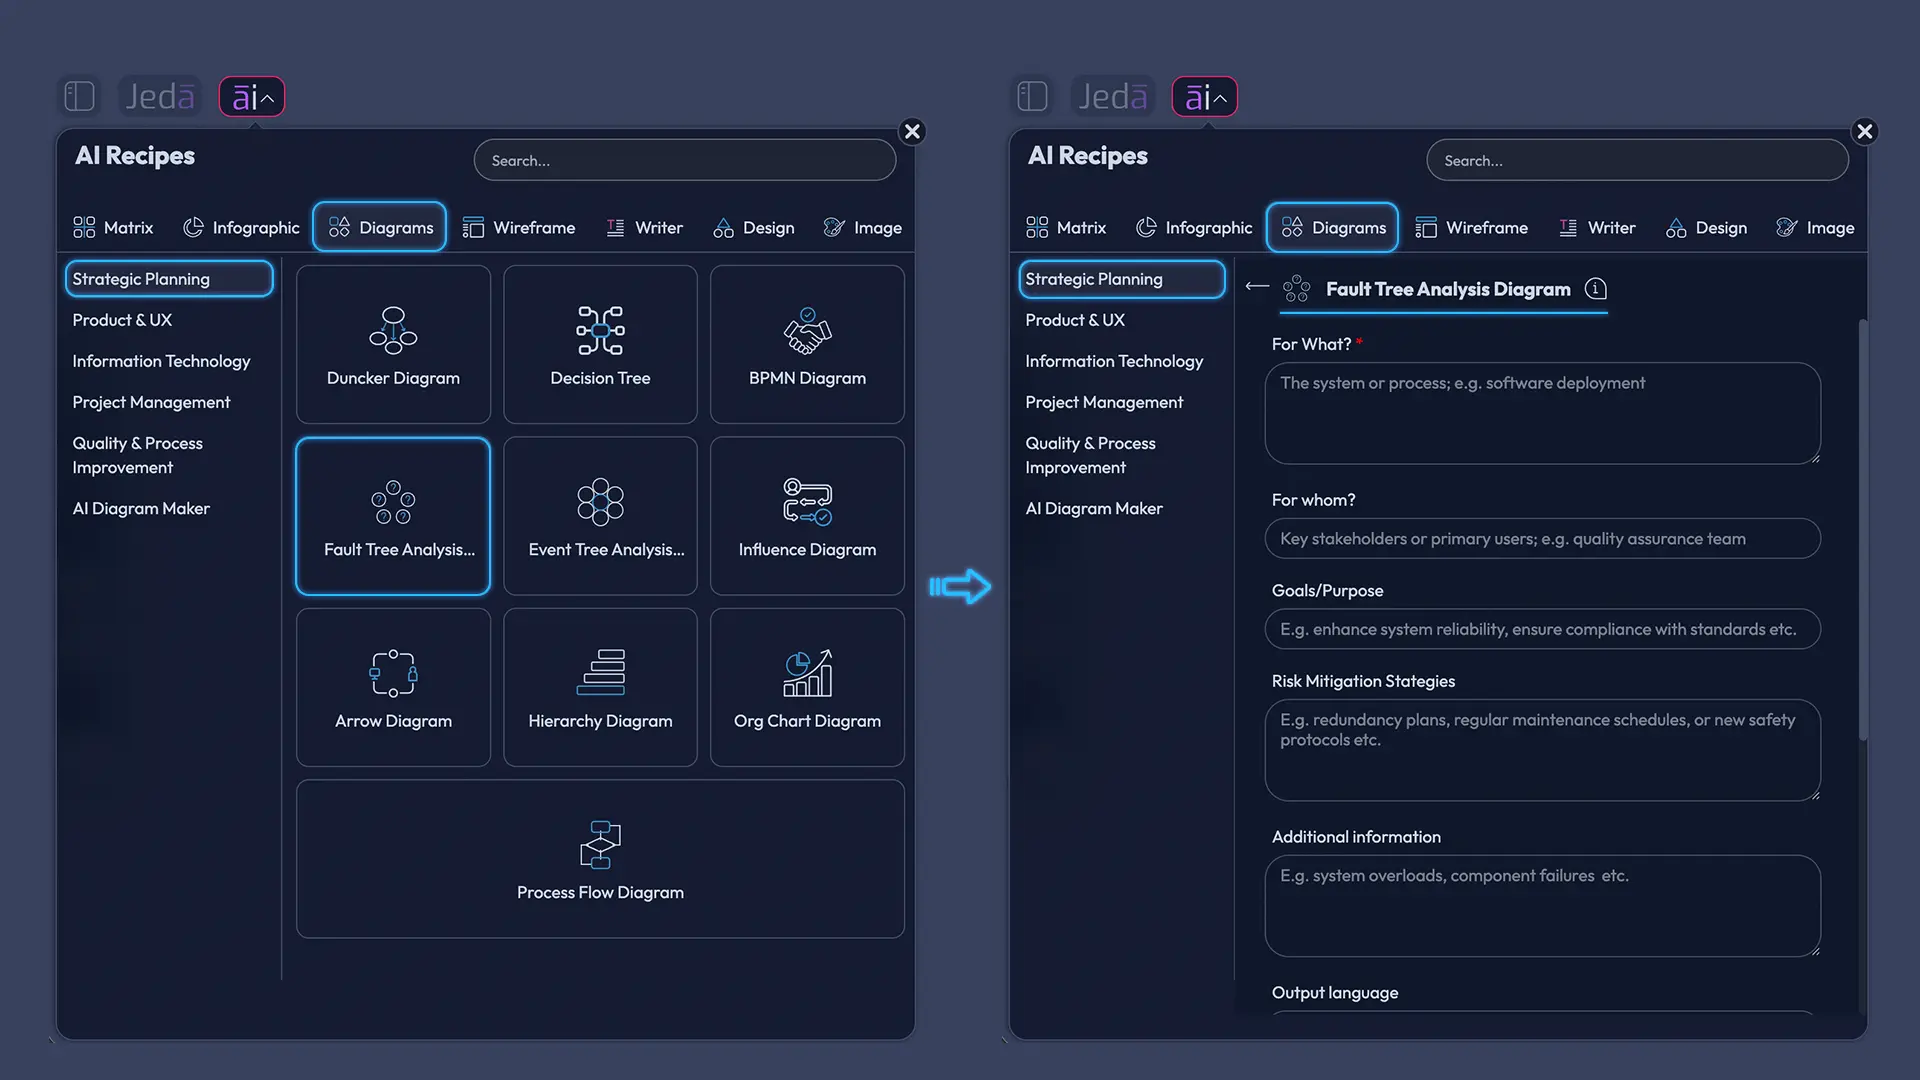
Start from the AI Menu, open the Diagrams category, and choose Fault Tree. Then fill in the usual guided fields such as For What?, For Whom?, Goals/Purpose, and More Context. From there, choose the layout, set web search if you need current standards or live incident context, choose your reasoning model, and select the diagram type that best fits the way you want the logic expressed.
For classic fault tree work, Basic Diagram is usually the best choice because it keeps the logic-tree feel front and center. Mind Map can help when you are still exploring candidate causes. Flowchart is useful when you want the analysis to hand off into decision or response steps. In many cases, a vertical layout reads more naturally because the top event sits above the contributing events, but horizontal layouts can work well for workshops and wide-screen reviews.
- Open AI Recipes and choose Fault Tree
Click ai∨ in the top-left corner, go to the Diagrams tab, and select the Fault Tree recipe.
- Define the risk clearly
Fill in For What, For Whom, Goals/Purpose, and More Context so the top event is specific, useful, and bounded.
- Choose the structure settings
Pick Horizontal or Vertical layout, turn Web Search on if current evidence matters, and choose your reasoning model.
- Select the diagram type and generate
Use Basic Diagram for a classic fault tree, or switch to Mind Map or Flowchart if the team needs a different visual emphasis.
- Review and refine on the canvas
Check the top event, gates, and branch logic. Edit node text, add missing causes, and reorganize branches as needed.
- Extend thoughtfully with AI+
Use the AI+ button to deepen a branch or continue the existing logic. It is best for expansion, not for a brand-new ultra-specific instruction.
Method 2: Use the Prompt Bar
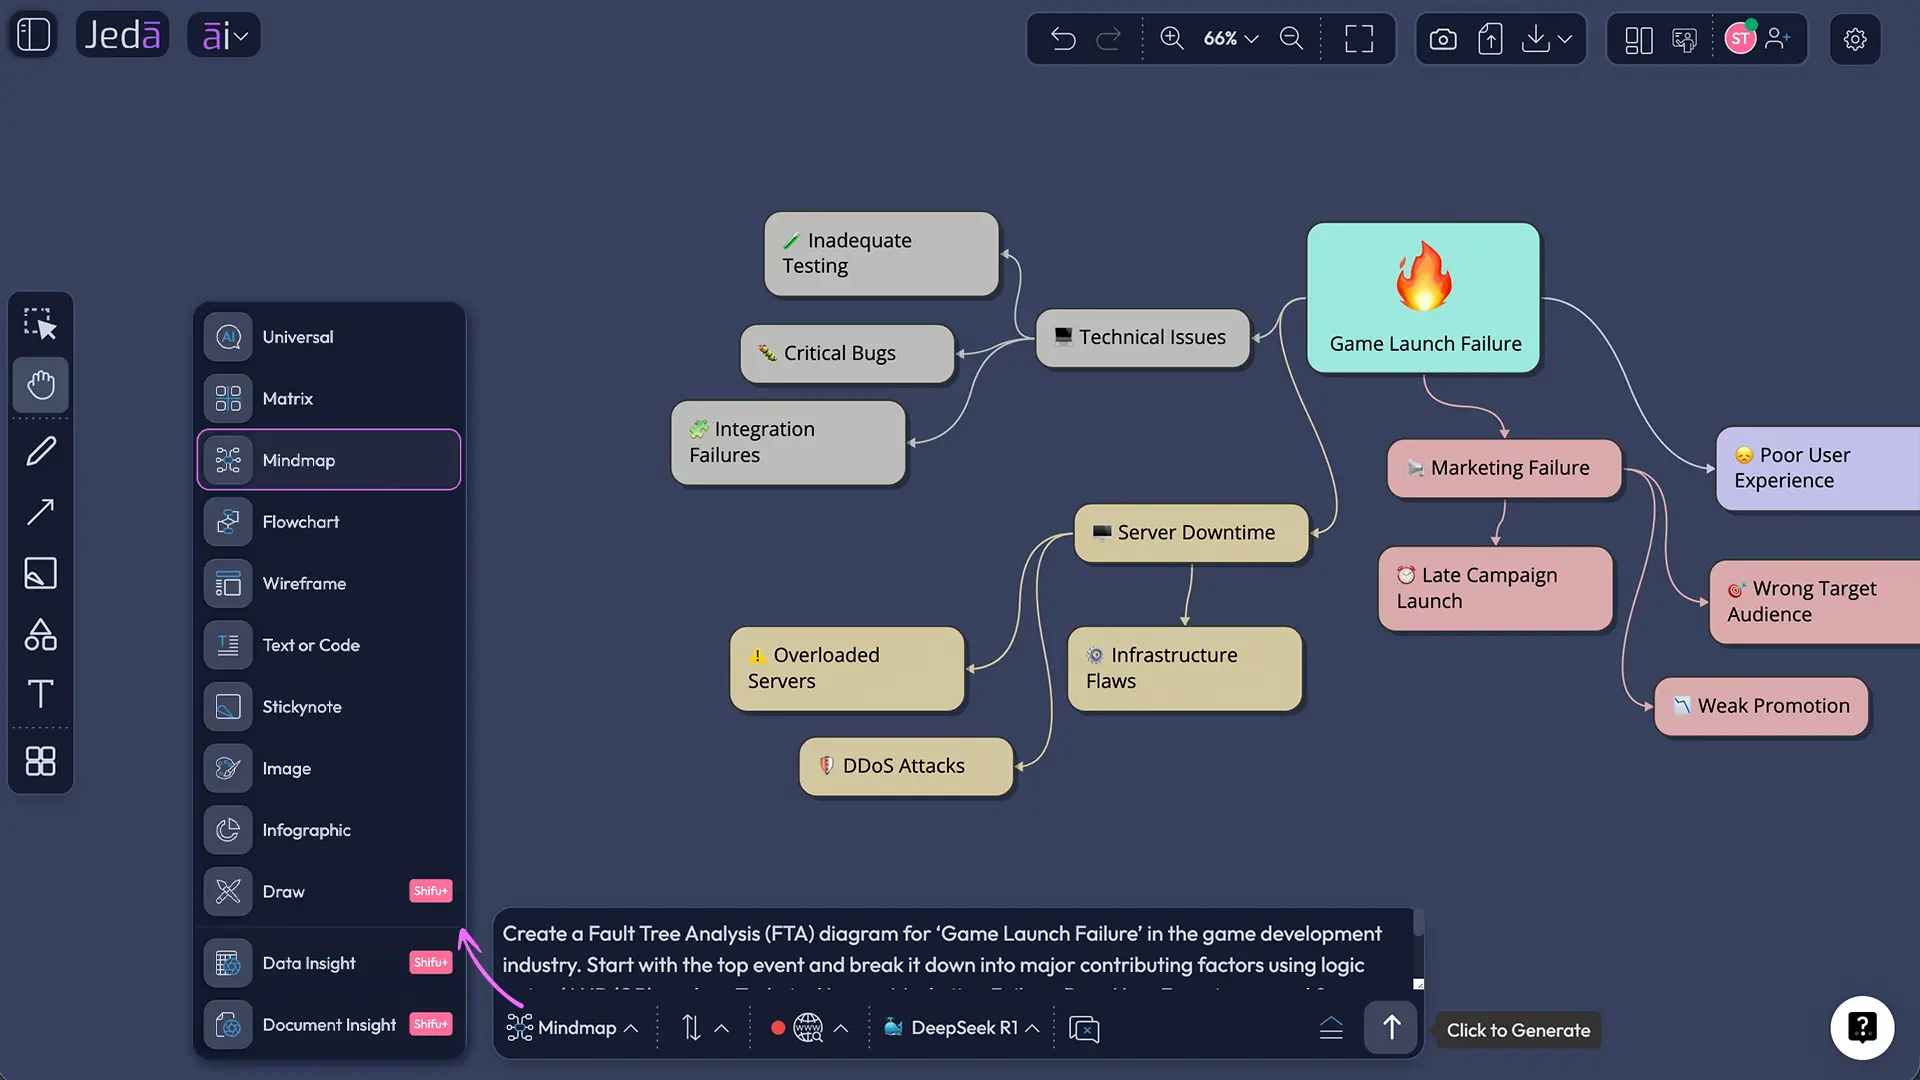
The Prompt Bar is the faster route when you already know the top event and the main failure groups. Open the Prompt Bar at the bottom of the canvas, choose the Diagram command, type your request in plain language, and generate. If you want current regulatory, operational, or industry context reflected in the tree, enable Web Search before you run it. Then choose your reasoning model and go.
A practical prompt sounds like this in plain English: build a fault tree for an unplanned industrial pump shutdown, show the top event, separate electrical, control-system, and mechanical causes, include AND and OR relationships where appropriate, and keep the branches at an engineering review level. Clean. Specific. No drama.
- Open the Prompt Bar
Use the Prompt Bar at the bottom of the canvas and select the Diagram command.
- Write the top event clearly
Name the undesired event first, then describe the major failure groups, system boundaries, and any depth you want.
- Set model and context options
Choose your reasoning model and turn Web Search on if you want live context to inform the structure.
- Generate and inspect the output
Review whether the branches represent failure combinations, not just a loose list of symptoms.
- Polish the logic visually
Edit labels, move nodes, clarify gate relationships, and use Smart Shape controls to improve readability.
- Transform if the next step needs another format
Use Vision Transform to convert the board into a flowchart or another visual if the team needs an execution view next.
What does a good Fault Tree Analysis with AI example look like?
Let’s make it concrete. Imagine your team is analyzing unplanned industrial pump shutdown. The top event is simple: the pump stops during normal operation. From there, the first-level branches might be electrical power loss, control-system failure, and mechanical seizure.
That is already better than a vague root-cause list, because a fault tree is about pathways and combinations. Under electrical power loss, you might include breaker trip, supply interruption, or wiring fault. Under control-system failure, you might branch into sensor failure, PLC output fault, or false interlock condition. Under mechanical seizure, you might include bearing failure, lubrication loss, or impeller obstruction. Some branches may require OR logic. Others may need AND logic. That distinction is the whole game.
What best practices make a fault tree more useful?
Good fault trees feel almost boring when they are done right. Clear top event. Consistent branch depth. Logic gates that mean something. No fluffy labels. No dramatic arrows pretending to be evidence.
Which mistakes weaken a fault tree?
The biggest mistake is treating fault tree analysis like root cause theater. Teams often force a single “main cause” too early, even though fault trees are built to show combinations. Another common problem is mixing symptoms, causes, and corrective actions on the same level. That muddies the logic fast.
There is also the temptation to stop at the first plausible branch. Bad move. The strongest fault trees surface alternative pathways, not just the first story that feels neat. And one more thing: if your gates are inconsistent or unlabeled in practice, the diagram may look professional while saying very little. Pretty nonsense is still nonsense.
Frequently Asked Questions
- What is Fault Tree Analysis with AI?
- Fault Tree Analysis with AI is the use of AI to draft, structure, and refine a top-down failure logic diagram faster. The method still depends on human review, but AI helps teams frame top events, branch contributing failures, and make the visual easier to edit and discuss.
- Is fault tree analysis the same as root cause analysis?
- No. Root cause analysis often looks for the underlying cause of a problem after it happened. Fault tree analysis works differently. It maps the combinations of failures that could produce an undesired event, which makes it especially useful for reliability, safety, and risk planning.
- When should I use the Diagram recipe instead of the Prompt Bar?
- Use the Diagram recipe when you want guidance, structure, and cleaner setup fields before generation. Use the Prompt Bar when you already know the top event and main failure groups and want a faster first draft on the Jeda.ai AI Workspace.
- Which diagram type should I choose for a fault tree in Jeda.ai?
- Choose Basic Diagram for the most classic fault-tree structure. Choose Mind Map when you are still exploring candidate causes. Choose Flowchart when the next audience needs a process-style view that can bridge the analysis into action, escalation, or operational response.
- Can non-engineers use Fault Tree Analysis with AI?
- Yes, if the top event is clearly framed and the team agrees on the system boundary. Consultants, business analysts, and project managers can use fault trees well, especially inside an AI Whiteboard where branches can be refined collaboratively with technical reviewers.
- How detailed should a fault tree be?
- Detailed enough to expose meaningful failure combinations, but not so deep that the tree becomes noise. A good rule is to decompose until the event is observable, actionable, or ready for quantitative treatment. If every branch keeps getting vaguer, the tree is going backward.
- What does the AI+ button do for a fault tree?
- The AI+ button extends an existing visual. In a fault tree, that means Jeda.ai can deepen a branch, add related contributors, or continue the same logic pattern. It is best used after the initial tree exists, not as a substitute for defining the top event properly.
- Can I convert a fault tree into another format in Jeda.ai?
- Yes. Vision Transform lets you select the existing visual and generate it in another format when the next step needs a different view. Teams often start with a fault tree, then convert the logic into a flowchart or another working visual on the same canvas.
- Is the output editable after generation?
- Yes. That is one of the biggest advantages of Jeda.ai. The generated diagram lands as an editable visual on the canvas, so you can rewrite nodes, move branches, adjust styling, and keep refining the analysis instead of rebuilding it in another tool.
If your current process still jumps between a diagram tool, notes, and review docs, this is the cleaner way to work. Jeda.ai gives you one AI Workspace, one AI Whiteboard, and one place to generate, challenge, and refine the logic. That is a better fit for modern risk analysis. And for teams working across 300+ strategic frameworks, it means your fault tree does not end as a static artifact. It becomes part of a living decision system.
Sources & Further Reading
- [1]
National Institute of Standards and Technology (n.d.) . “Fault Tree Analysis” NIST CSRC Glossary.
View Source ↗ - [2]
Chenyu Chu et al. (2024) . “Dynamic Fault Tree Generation and Quantitative Analysis Method for Embedded System Reliability Based on Improved Modeling” Sensors.
View Source ↗ - [3]
SafetyCulture (2025) . “Fault Tree Analysis Guide with Example” SafetyCulture Topics.
View Source ↗
Start Fault Tree Analysis with AI on Jeda.ai
Join 150,000+ users building clearer failure logic on one Visual AI canvas.
Try Jeda.ai Free