Are There Any All-in-One Tools for Diagrams and Presentation Without Needing to Switch Apps?”
All-in-one tools for diagrams and presentations are becoming essential because nothing slows down a consultant’s day more than hopping between five different platforms just to finish a single deck. For many US business consultants, the pain is real: one app for whiteboards, another for diagramming, another for slides, and another for note-taking. Every switch breaks focus, drains energy, and disrupts your strategic flow.
TL;DR
● Stop wasting time switching between diagram, whiteboard, and presentation apps.
● All-in-One Tools for Diagrams and Presentations unify workflows in a single AI workspace.
● Instantly turn PDFs, sketches, or spreadsheets into diagrams, flowcharts, and infographics.
● Real-time collaboration, AI-powered templates, and exports boost productivity and clarity.
The Real Problem: Too Many Tools, Too Little Flow
Most consultants don’t struggle because they lack skill; they struggle because their workflow is scattered across diagramming tools, slide builders, whiteboards, and endless tabs. This fragmentation destroys focus, interrupts strategic thinking, and inflates the mental load required just to get simple tasks done. The constant jumping creates workflow fragmentation that chips away at energy you should be spending on clients, not on managing platforms.
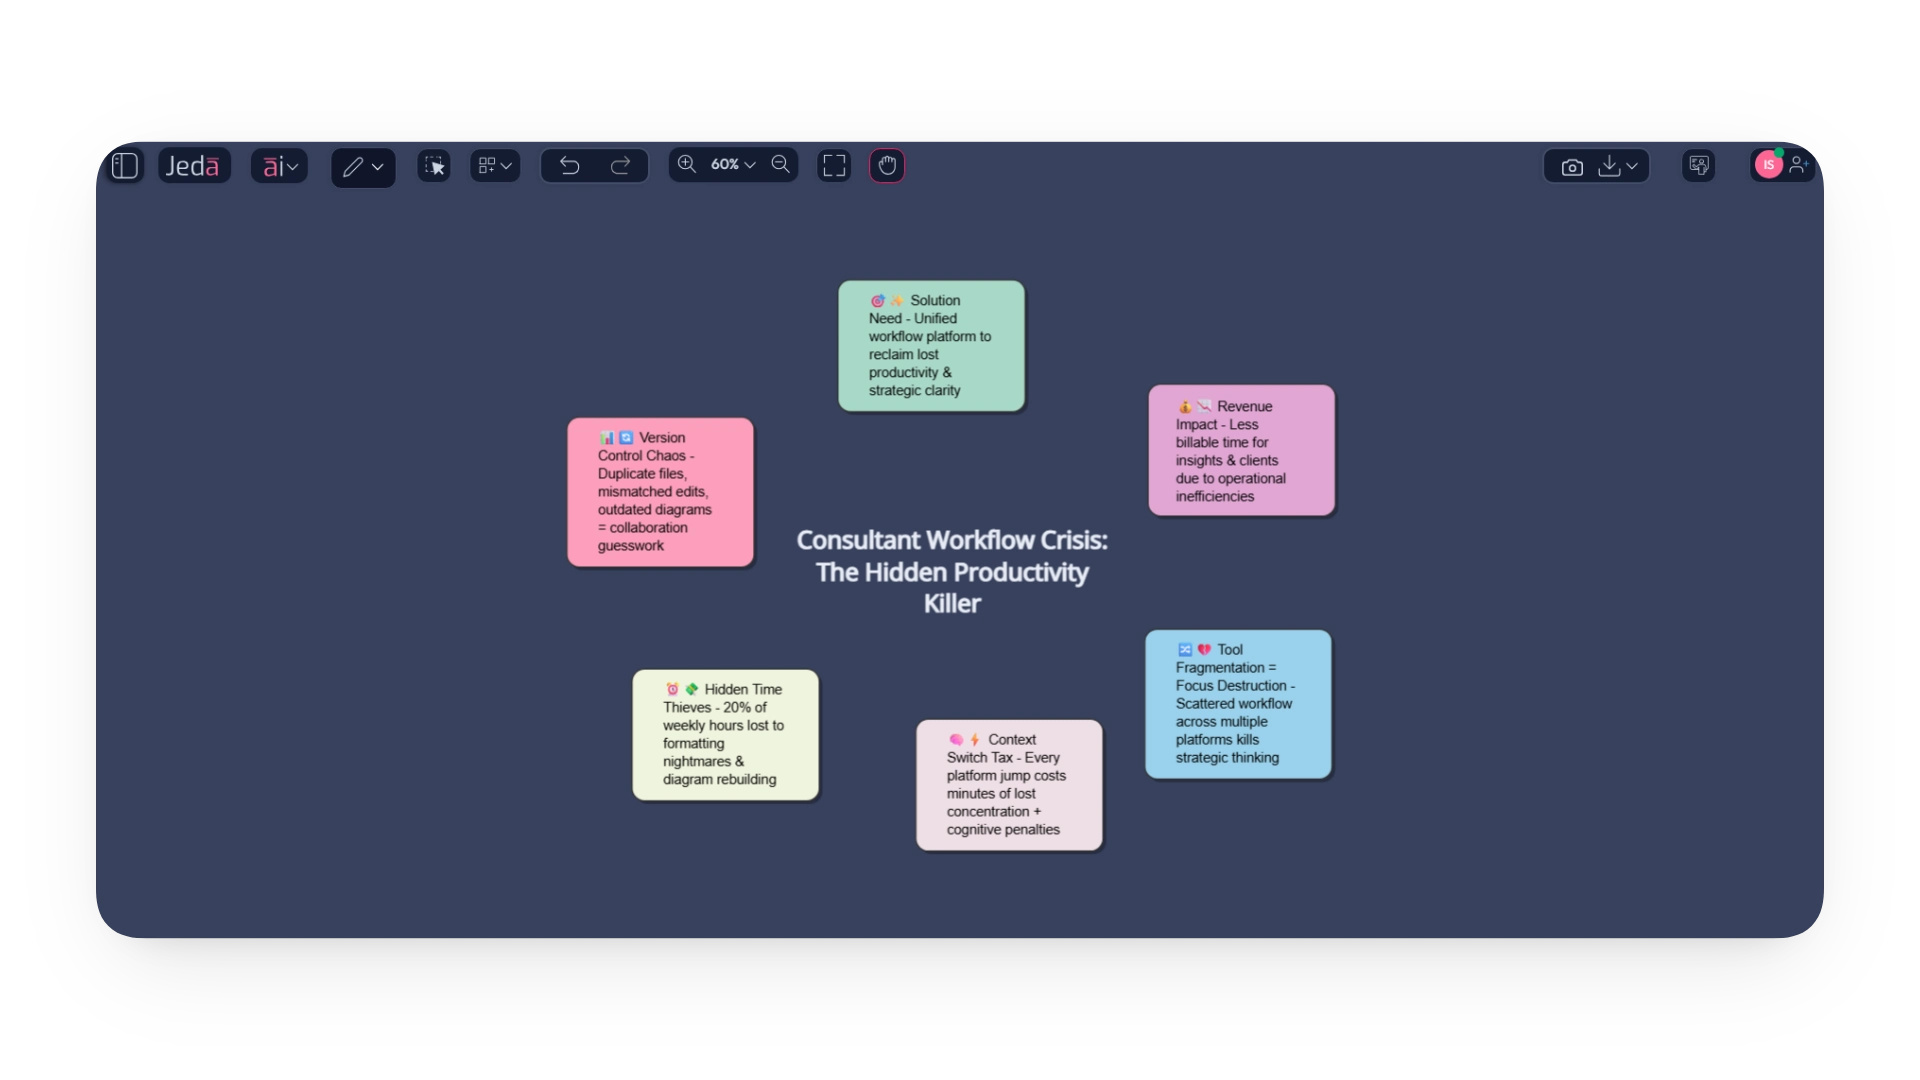
The Hidden Drain: Every Switch Costs You More Than You Think
High-ranking research on context-switch fatigue shows that even micro-interruptions can derail concentration for several minutes at a time. Multiply that by a consultant’s day: diagrams, notes, flowcharts, and version revisions, and you’re losing hours of billable time without even noticing. This isn’t about preference; it’s about cognitive penalties that slow down problem-solving and strategic clarity.
Where Time (and Money) Really Disappear: Fragmented Tools = Fragmented Output
When every piece of your work lives in a different tool, deck creation becomes a formatting nightmare. Rebuilding diagrams, realigning shapes, resizing icons, and retyping notes can swallow up 20% of a consultant’s week. Meanwhile, version control chaos turns collaboration into a guessing game: duplicate files, mismatched edits, outdated diagrams, and missing flowcharts. These inefficiencies quietly increase operational costs and reduce the time you can spend on insights, clients, and growth.
Why Consultants Feel The Pain More Than Other Professions
You can’t ignore it: consulting is almost visual-first. Strategy diagrams, client-ready charts, and workflow illustrations aren’t just supplementary; they are the product. Misaligned tools for building these visuals often break storytelling flow, leaving consultants scrambling to make slides cohesive and convincing. This isn’t just frustrating; it’s a productivity drain.
🥊 Client Presentation Challenges Amplified: Ever noticed how fragmented visuals reduce client buy-in? When diagrams, decision trees, and workflow charts are created across multiple apps, narratives lose clarity. Clients spend more time decoding visuals than absorbing insights. For consultants, this means hours spent aligning slides rather than guiding strategy discussions: critical time that impacts both delivery and reputation.
🥊 Junior Consultants Bear the Brunt: Junior team members often spend 40–60% of their week formatting slides and fixing inconsistencies. With all-in-one tools for diagrams and presentations, that time collapses instantly.
🥊 The “Deck is the Product” Pressure: In consulting, the deck is often the deliverable. Every slide, diagram, and decision tree must be perfect. Yet, inconsistent tools and fragmented workflows break the rhythm of storytelling. Misaligned visuals not only slow production but also dilute persuasive power, turning hours of strategic thinking into tedious formatting battles.
Why Workflow Alignment Matters
When visuals, slides, and narratives aren’t synchronized, even brilliant strategies look scattered. Workflow alignment is more than internal organization; it drives client trust. Consultants who can unify complex strategy diagrams in a single Visual AI Canvas maintain coherence, accelerate decision-making, and reduce repetitive formatting pain.
Where Traditional Tools Break Down
Ever felt like your tools are working against you instead of for you?
For US business consultants, strategy consultants, and boutique firm practitioners, juggling multiple platforms is more than frustrating, it’s a productivity killer. From brainstorming to final presentations, traditional apps often create more problems than they solve.
🥊 Diagram Export Issues; PNGs That Blur: One of the most common headaches is exporting diagrams. Current market tools make it easy to 'manually' build 'somewhat' detailed visual frameworks, but the moment you export to PNG for slides, clarity suffers. Blurry images, distorted shapes, and lost details mean extra hours in slide deck rework, all while trying to maintain visual consistency across client-ready materials.
🥊 Tool Fragmentation Consulting - The Multi-App Maze: Most consultants rely on a mix of apps: one for brainstorming, another for diagrams, slide decks for presentations, and word processors for notes. Each platform is great individually, but integrating them creates friction. Copy-pasting, resizing, and reformatting across apps drains time and introduces errors, leaving teams frustrated and slowing down project delivery.
🥊 Presentation Rework - The Hidden Time Sink: Slides rarely reflect the diagrams you’ve carefully crafted. Fonts, shapes, and brand colors often clash when transferring visual assets, forcing repeated tweaks. Even minor inconsistencies can make deliverables look unpolished, undermining credibility with clients. Consultants spend more time fixing slides than analyzing insights, a serious productivity drain.
Complex data visualizations often refuse to “play nice” across tools. Charts, graphs, and dashboards built in one platform rarely match layouts in another, creating mismatched visuals. Without a unified canvas, teams risk overwriting edits or losing updates. The constant back-and-forth breaks flow, reduces efficiency, and raises stress levels.
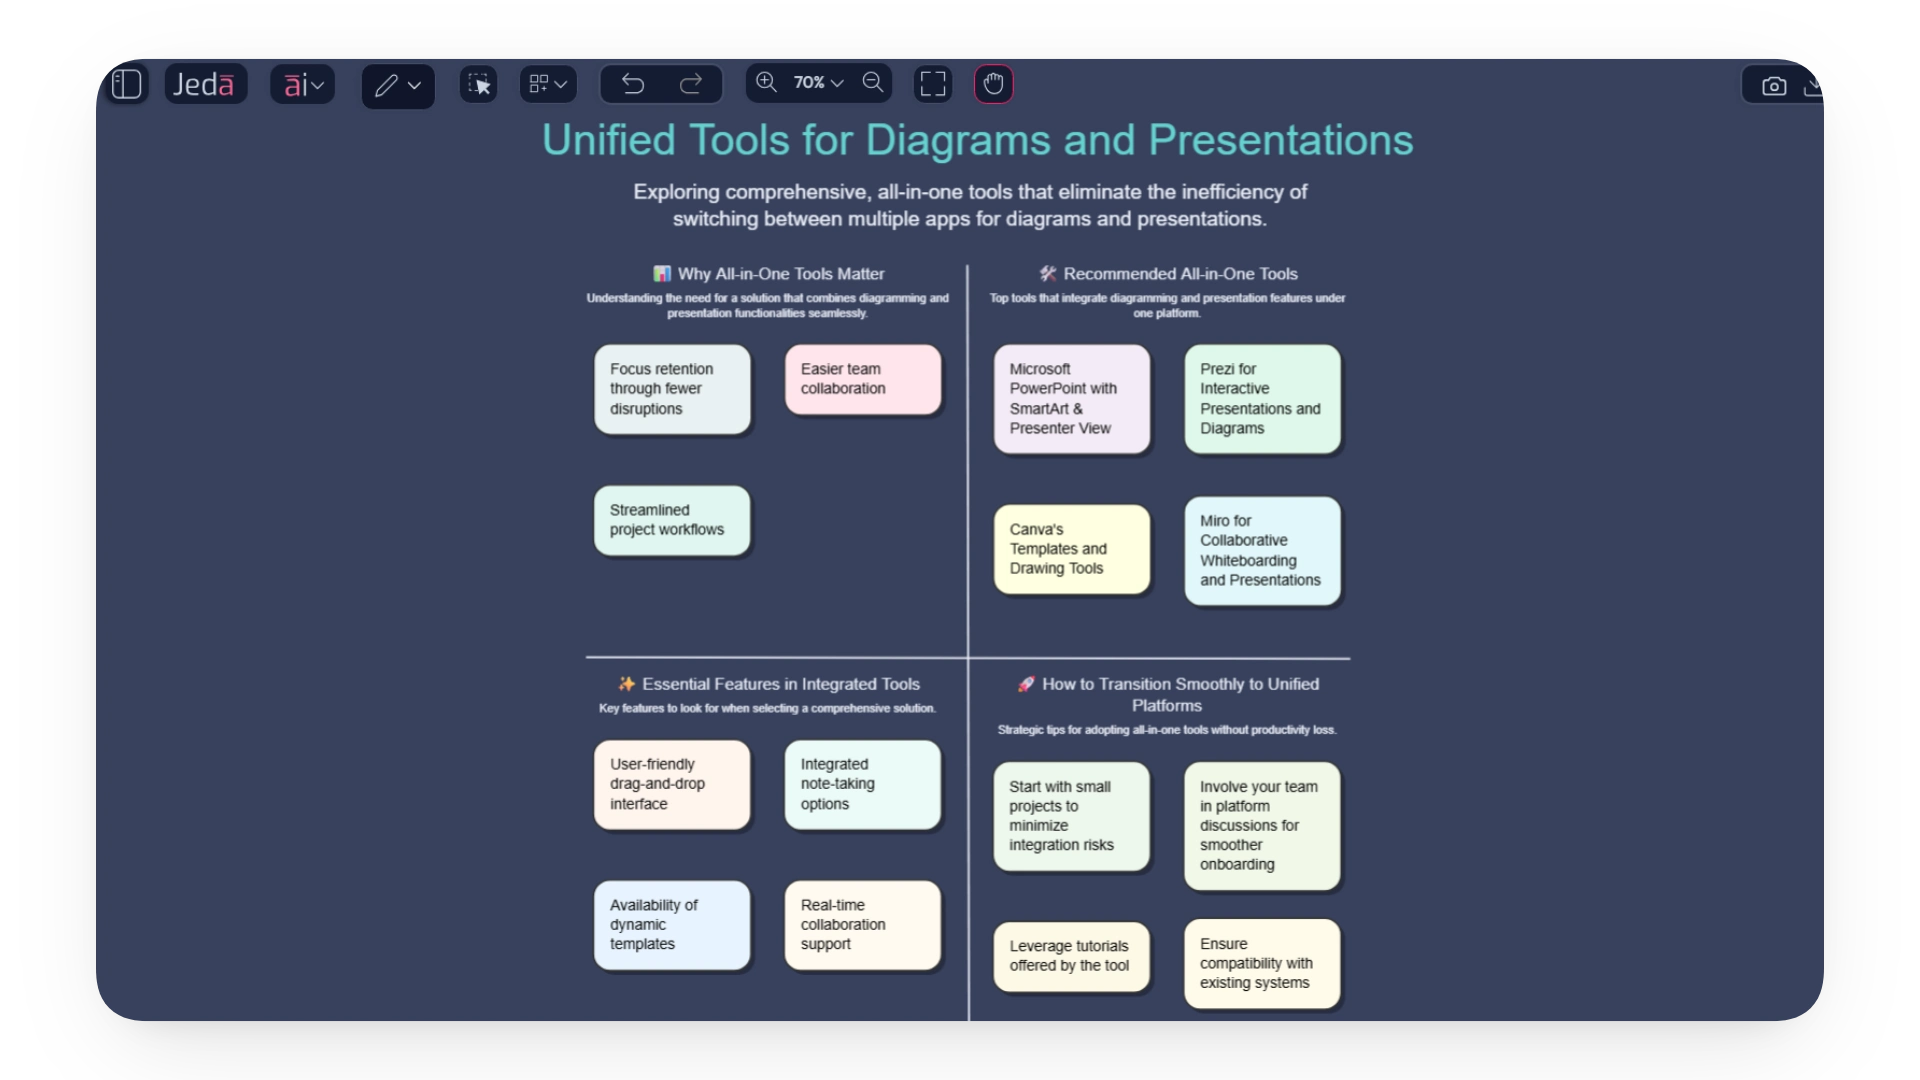
The Need For All-in-one Tools for Diagrams and Presentations
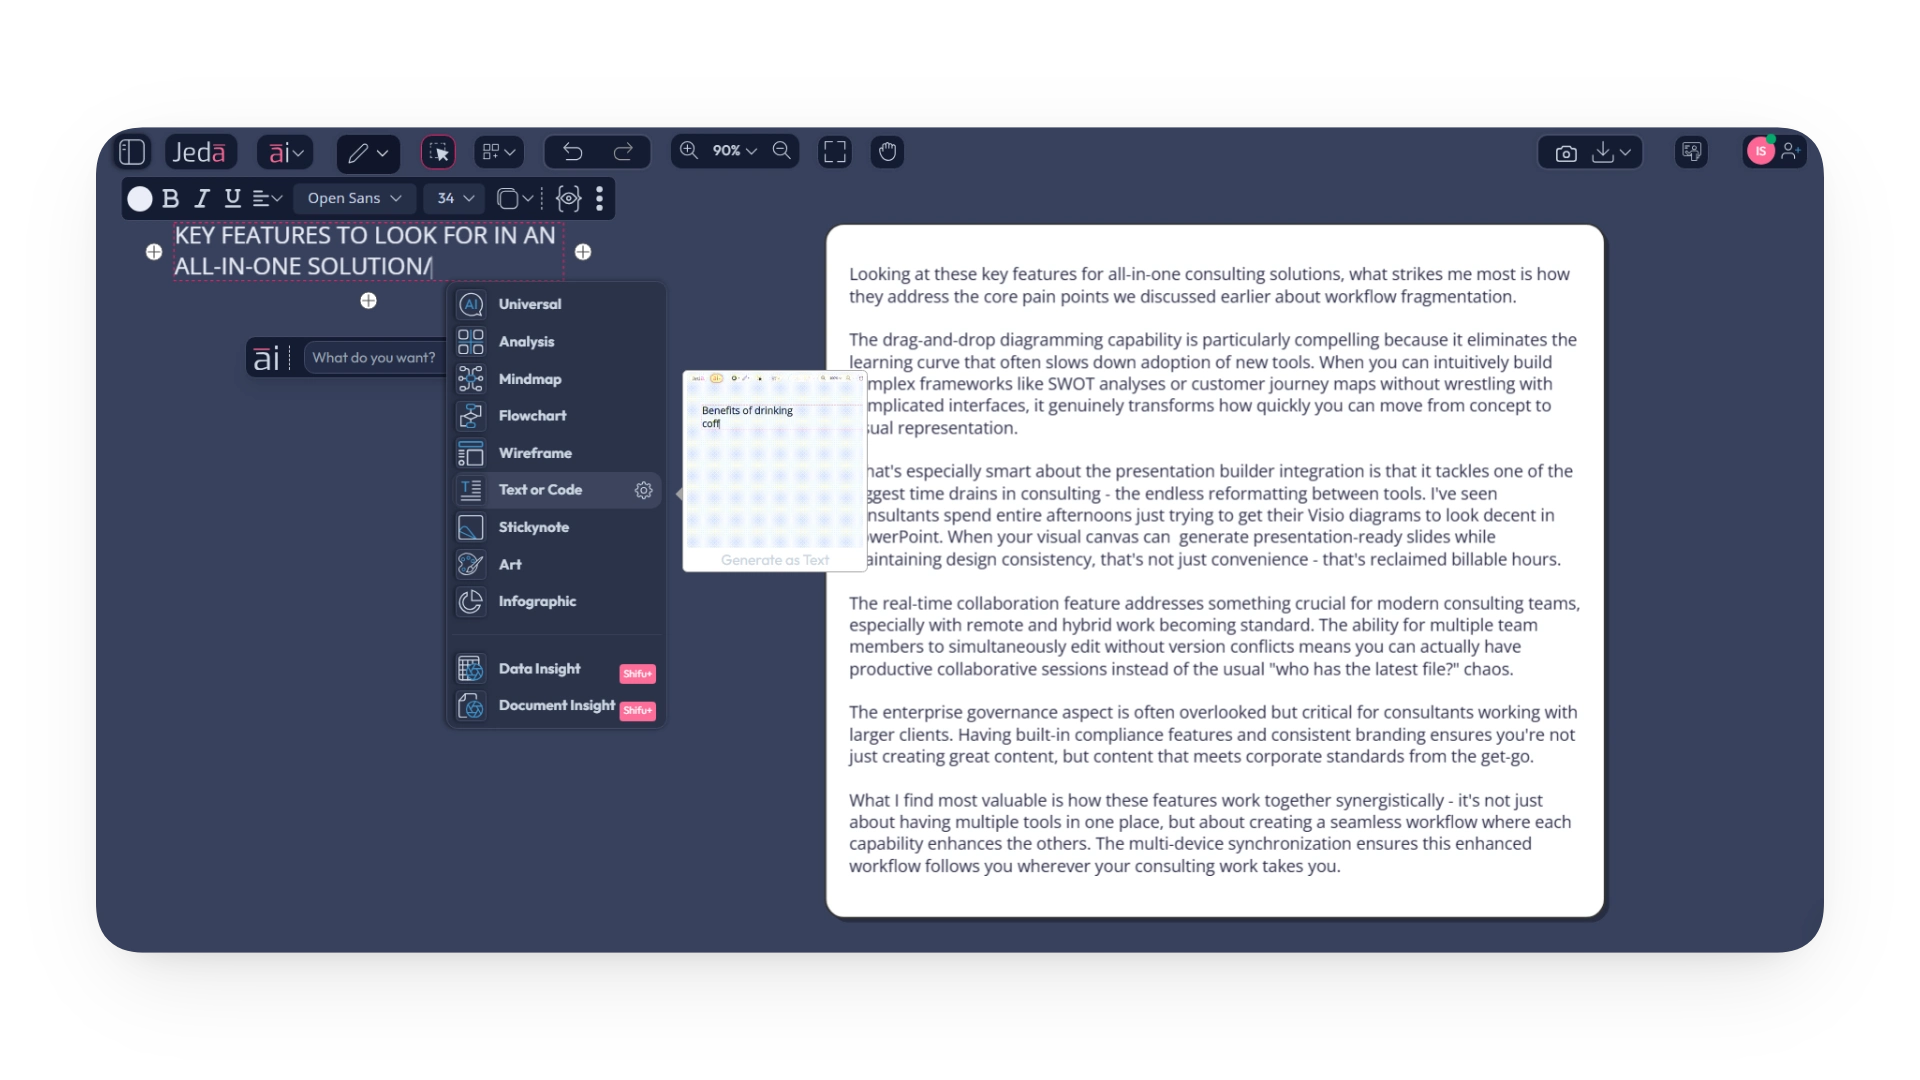
🎯 Why Visual Flow Matters More Than Features: Ever felt your workflow slow down because you were juggling too many apps? That’s the exact pain point an all-in-one diagram tool solves. When consultants rely on multiple platforms, visual continuity suffers, making complex ideas harder to communicate. Using a unified workspace ensures your diagrams, mind maps, and charts tell a seamless story without extra clicks.
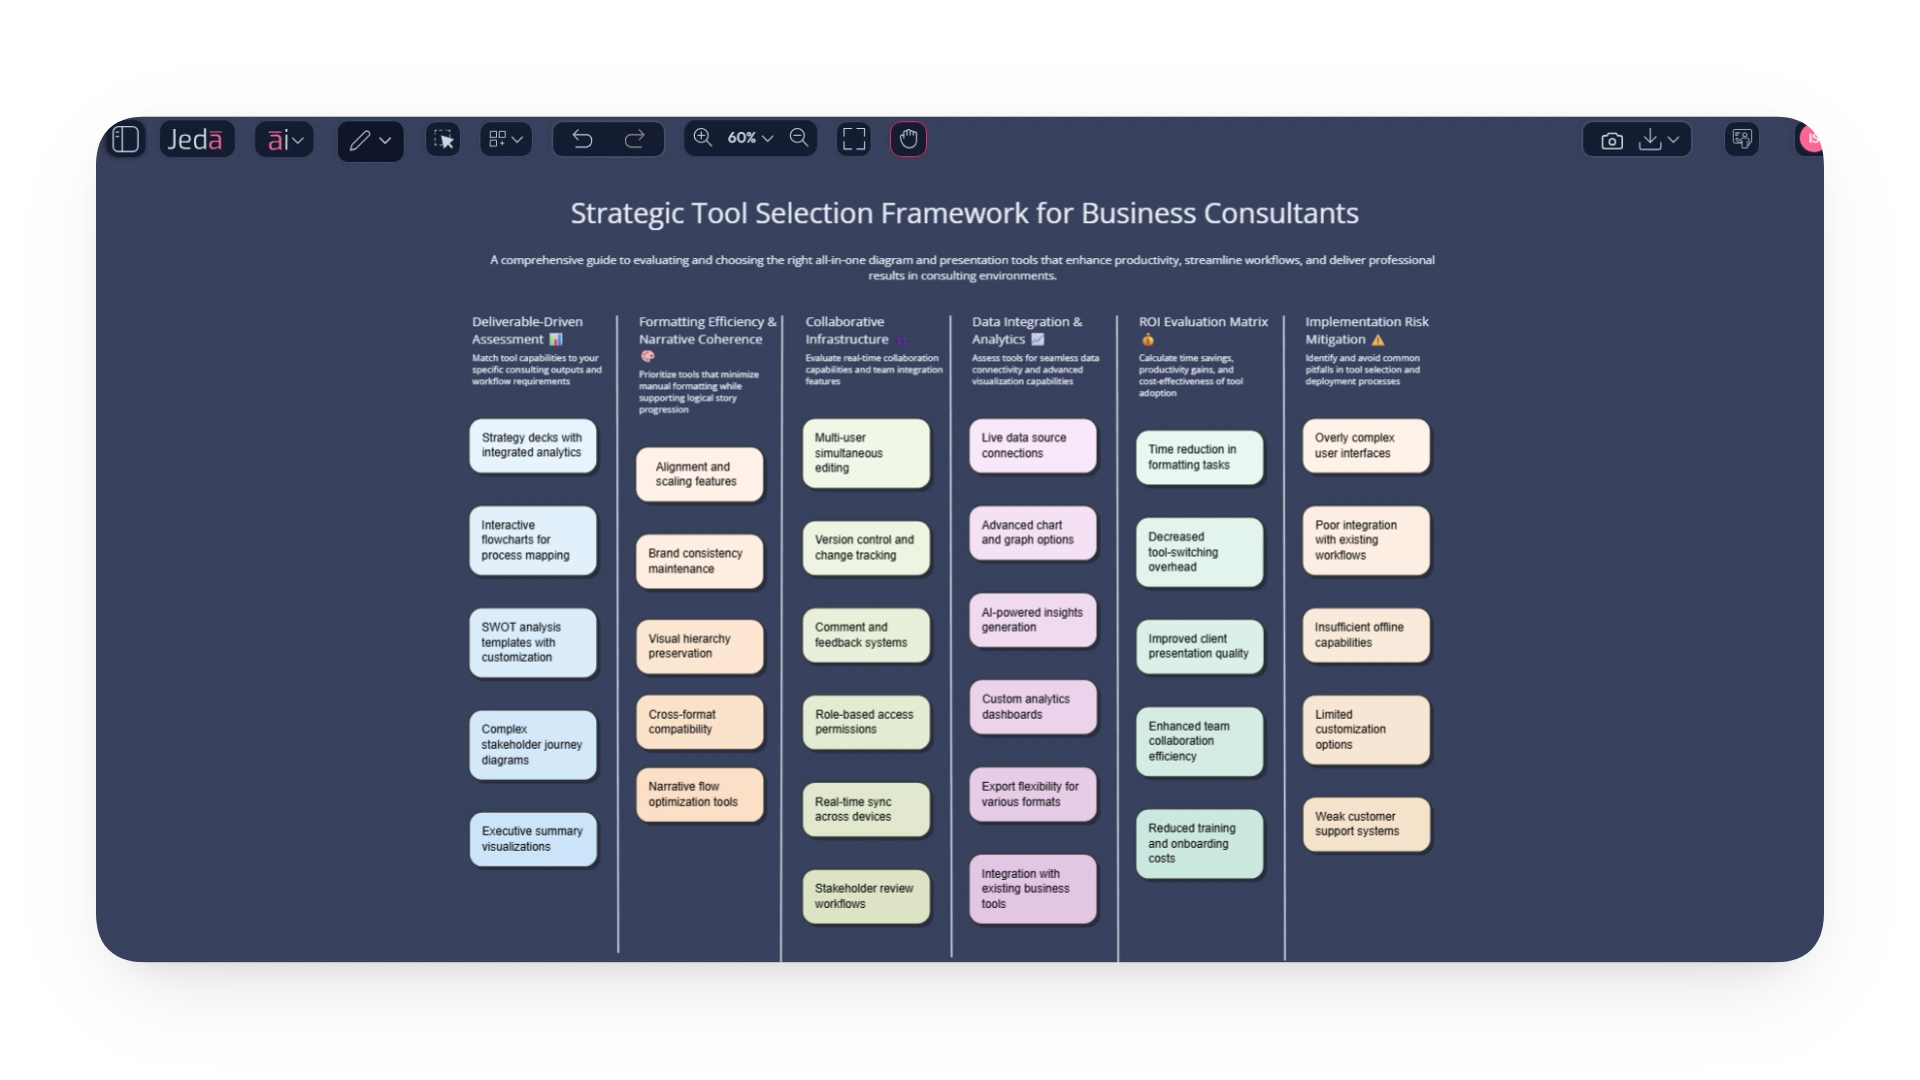
🎯 Unified Tools That Improve Storytelling: A tool that centralizes your work isn’t just about convenience; it’s about impact. Visual AI Workspace platforms let you move from brainstorming to finalized presentations with a smooth visual flow. For consultants, this reduces cognitive load and elevates client presentations, ensuring your insights are understood quickly and memorably. No switching apps means more focus on the strategy, not the software.
🎯 Reduced Errors and Cross-Device Accessibility: Switching apps can introduce mistakes, from misplaced data to formatting issues. All-in-one diagram tools minimize these errors by keeping everything in one AI Workspace Canvas. Multi-model AI agents provide consistent outputs across devices, so whether you’re in a client meeting or remote session, your visuals stay accurate, polished, and instantly shareable.
🎯 Real-Time Collaboration Across Teams: Collaboration shouldn’t slow down your consulting workflow. A strong AI workspace enables multiple team members to edit diagrams, strategy templates, and document analysis simultaneously. Real-time updates combined with AI workflow assistance help boutique firms and independent consultants manage cross-functional collaboration efficiently without losing track of changes.
Why Jeda.ai Is the First True All-in-One Tool for Diagrams and Presentations
For consultants and strategists, the constant switch between diagramming tools, slide decks, data apps, and note-taking software shatters focus and kills productivity.
Jeda.ai is the solution - the world's first Agentic AI Whiteboard, designed to consolidate your entire workflow into a single, intelligent canvas.
Jeda.ai is not just another diagramming tool. It is a multimodal AI collaboration hub where multiple AI models work together on your canvas to turn strategy into action, visually.
Think Visually → Craft Strategy → Inspire Stakeholders.
Why Jeda.ai is the Ultimate All-in-One Workspace
1. Unmatched AI Power: The Best AI Models, Working Together
🎯 Multi-LLM Collaboration: Chat with ten leading AI models (like GPT-5, Claude Opus, LLaMA, and Grok) simultaneously on the same canvas.
🎯 Expert Perspectives Instantly: It’s like having a team of sharp consultants debate, cross-check, and merge the best ideas into a clear first draft for you.
🎯 Multimodal Input: Use both visual and text prompting. Feed the AI notes, screenshots, charts, or raw text directly on the canvas.
2. Transform Any Input into Client-Ready Outputs
Simply drop your source material onto the canvas and watch Jeda.ai convert it into professional assets:
🎯 From Documents: Upload PDFs, reports, or resumes to instantly generate SWOT analyses, GTM frameworks, mind maps, and flowcharts.
🎯 From Data: Upload Excel/CSV files. Ask plain-language questions, and the AI generates clear charts, dashboards, and "so-what" summaries.
🎯 From Rough Sketches: Use AI Vision to snap a picture of a whiteboard or a doodle and convert it into a polished mind map, flowchart, or wireframe.
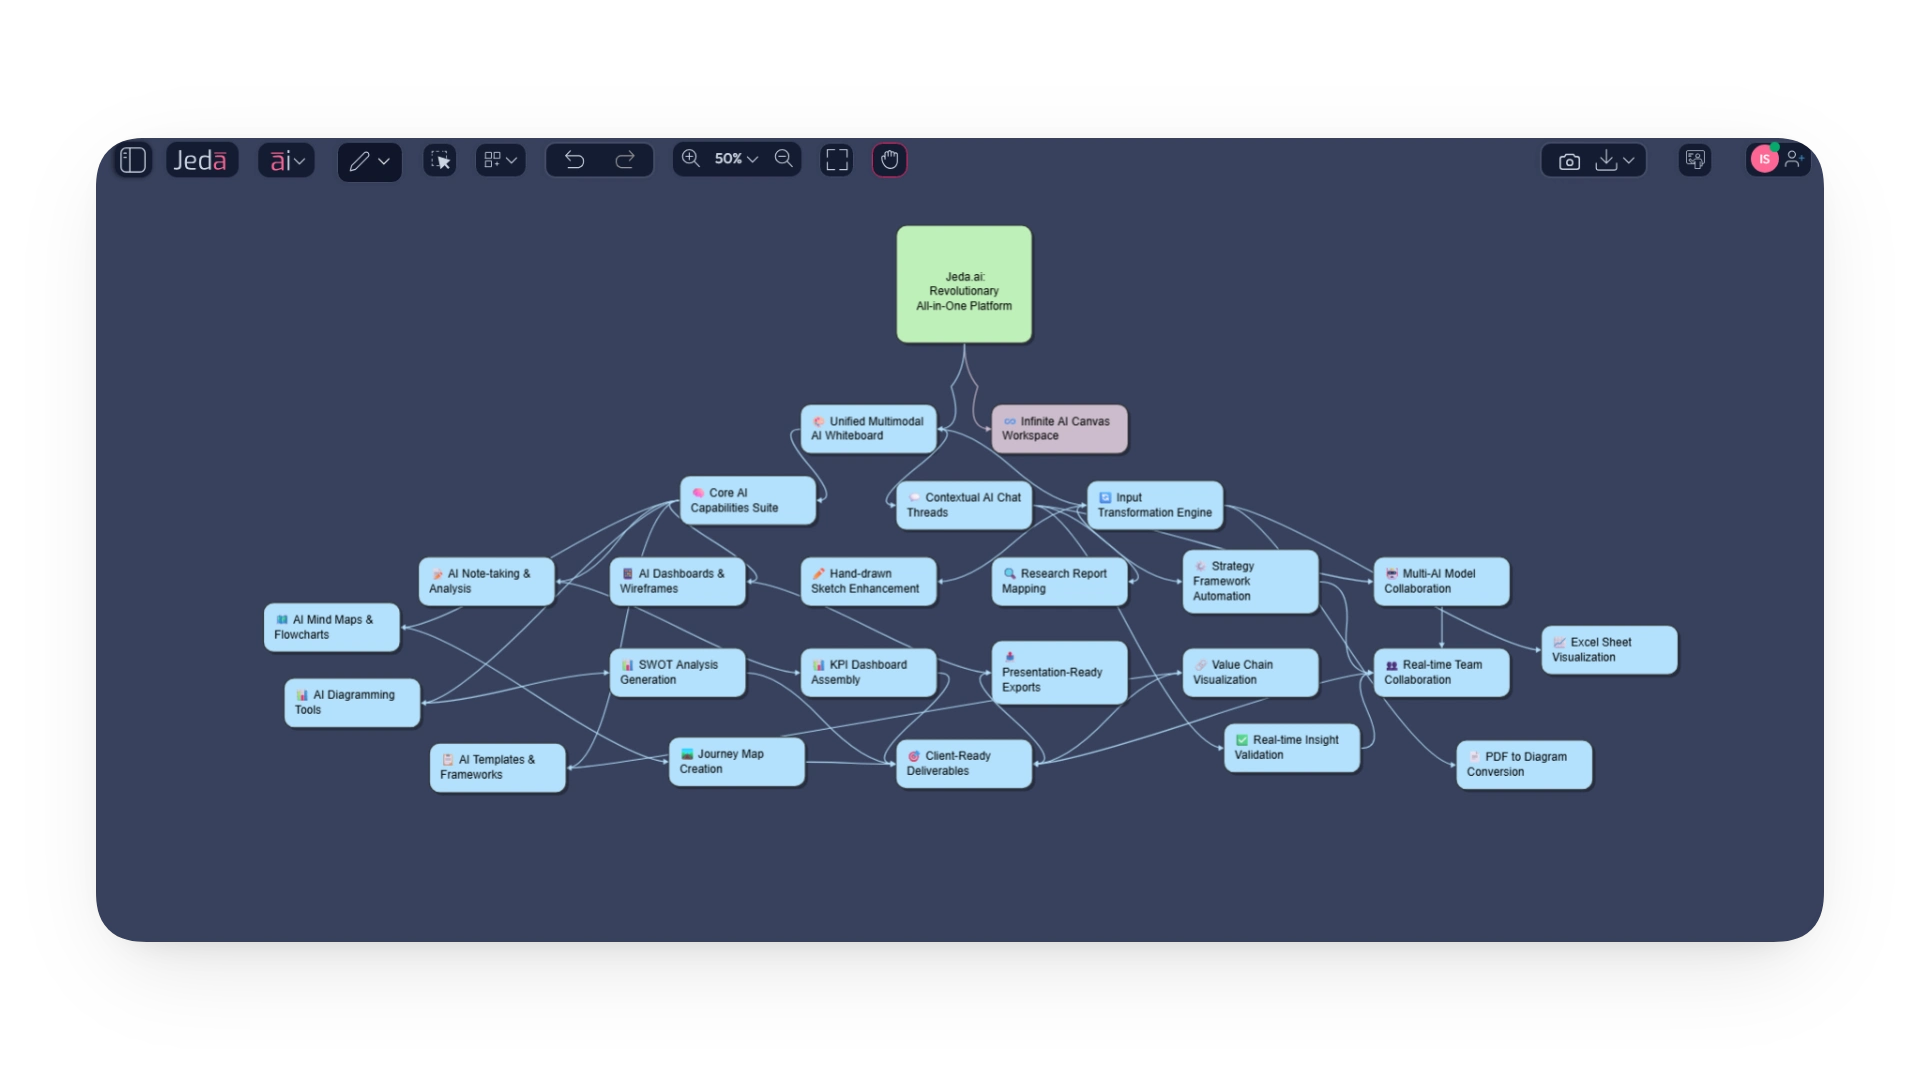
3. Pre-Built Intelligence for Strategic Outcomes
Skip the blank canvas and formatting fatigue with AI-powered templates and recipes:
🎯 Strategic Frameworks: Handcrafted templates for SWOT, PESTEL, TRIZ, and 300 more.
🎯 AI Diagram Recipes: Ready-to-use templates for Duncker diagrams, decision trees, stakeholder maps, org charts., user journey, and more.
🎯 AI Infographics: Turn raw numbers into clean, one-page stories with 100+ templates.
4. A Unified Suite of Powerful Tools in One Canvas
🎯 AI Diagramming & Mind Mapping: Generate and customize flowcharts and mind maps in seconds.
🎯 AI Wireframing: Draft low-fi wireframes and instantly convert them into visual mockups.
🎯 AI Note-Taking: Capture ideas by typing or drawing, and let the AI structure them into sticky notes.
🎯 AI Art Generation: Create campaign visuals and proposal banners using style recipes like Corporate Memphis, all without leaving the canvas.
🎯 Real-Time Collaboration & Presentation: Work with your team live, then export directly to slide decks or present from the canvas itself.
Jeda.ai eliminates the friction in the creative and strategic process. It replaces a dozen disparate apps with one Agentic AI Workspace that helps you:
🪄 Work Faster: Go from idea to client-ready visual in minutes, not hours.
🪄 Think Deeper: Leverage multiple AI models to validate and refine your strategies.
🪄 Present with Impact: Create stunning, consistent visuals and presentations without ever switching tabs.
Ready to elevate your work? Turn your ideas, data, and documents into actionable strategy on the world's most advanced AI Whiteboard.
→ Sign up for Free and experience the future of visual collaboration.
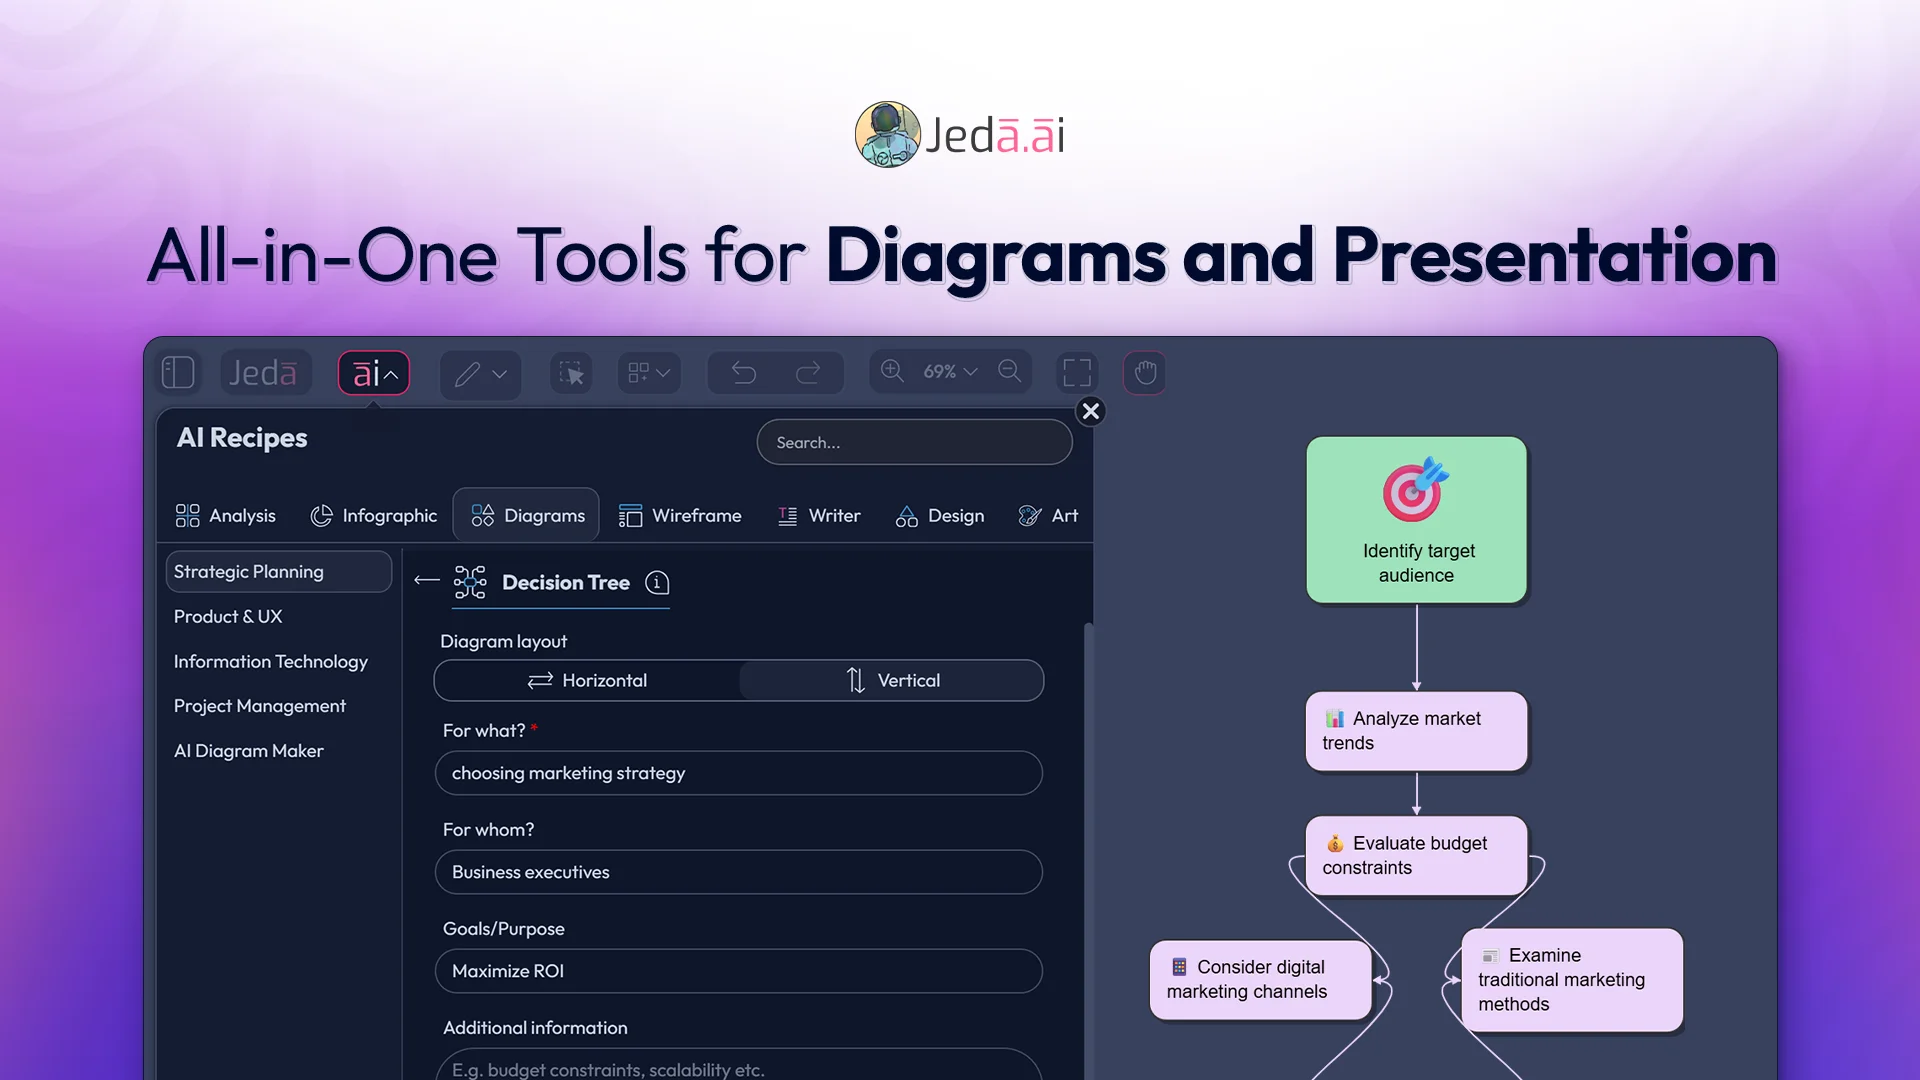
How to Generate Diagram with AI Whiteboard on Jeda.ai's Agentic AI Workspace
🪄 Log in to Jeda.ai and enter an AI workspace of your choice.
🪄 Navigate to the AI Menu located at the top left corner to visit the Diagrams tab. Under Strategic Planning, select the option for Duncker Diagram.
🪄 Respond to a few intuitive questions related to your problems/issues.
🪄 Choose your preferred layout, diagram type, and AI model(s).
🪄 Hit “Generate”.
🪄 Customize, transfer to your slide deck, and edit there.

Wrapping Up
The truth is simple: consultants lose enormous amounts of time switching between tools for diagrams, whiteboards, flowcharts, and slides. This fragmentation hurts clarity, slows delivery, and creates unnecessary rework, especially during high-stakes client engagements.
All-in-One Tools for Diagrams and Presentations solve this by unifying diagramming, analysis, collaboration, and presentations in one Visual AI Workspace. With platforms like Jeda.ai offering multimodal AI, multi-LLM support, diagram generator, and presentation export, consultants finally get a workspace that accelerates thinking instead of interrupting it.

