
⭐ Jeda.ai’s New Workspace Console: Floating Toolbar, Visual AI & Smarter Diagrams
This update isn’t “UI polish.”
It’s a workflow weapon upgrade for people who live in strategy: business consultants, PMs, and decision makers who need to move from whiteboard chaos to crisp, defensible narratives fast.
We’ve redesigned how you interact with the AI canvas, how you invoke AI, and how diagrams communicate logic - without bloating your mental load.
1. The New Floating Toolbar: Your Control Panel on the Left
The AI whiteboard toolbar has been redesigned and relocated for more space, more power, and less friction.
A. From top bar to left-side floating toolbar
Previously: Tools were crammed into a top toolbar, fighting for horizontal space.
Now: You get a floating, left-side toolbar with clean icons for:
- Select
- Pan
- Pen
- Arrow
- Sticky Note
- Shapes
- Text
- Add-Ons
Click any of these (except Select and Pan), and a detail panel unfolds with deeper capabilities.
This matters for consultants & decision makers because it turns the toolbar into a tactile cockpit instead of a cluttered shelf.

Contextual controls: less noise, more depth
➡️ Click the sticky note tool → you get controls for:
- Colors
- Shapes
- Additional styling options
Ideal for visually encoding priority, status, or ownership in your frameworks.
➡️ The pen tool now holds:
- Pen
- Brush
- Laser Pointer
Each with its own:
- Thickness
- Color
- Behavior
Great for live teaching, sketching flows, or emphasizing transitions.
➡️ Our arrow Tool holds:
- Arrow
- Line
Both configurable with the right visual weight and style for hierarchies, flows, and influence diagrams.
➡️ Jeda.ai’s shape tool now bundles:
- Rectangle
- Circle
- Oval
- Triangle
Each with shape-level styling, so you can build clean, consistent frameworks without hunting through menus.
You’re no longer “clicking through a maze.” You’re choosing a tool → getting all its intelligence in one place.

B. File upload joins the “workspace control cluster”
Previously: File upload sat inside a combined top toolbar.
Now: File Upload lives on the top right, next to the Screenshot and Download menu.
This brings content in/out controls into a single “I/O zone”, easier to explain to teams, easier to remember in the middle of a live session.
C. Undo, Redo, Zoom: grouped where your hand already is
Undo, redo, and zoom were previously separated and too close to the old top toolbar.
Now - Undo / Redo / Zoom live together as a single tool set at the top right.
When you’re presenting live, you’re often fixing small mistakes while talking. Grouping these controls means less fumbling, fewer awkward pauses, and smoother facilitation.
2. AI Vision & AI Command Bar: One Unified “Think Here” Zone
This is a big UX simplification with a massive payoff for cognitive load.
Previously:
👉 AI Vision (formerly AI Alchemy) appeared below selected objects on the canvas.
👉 It was powerful but visually noisy; extra UI popping under objects every time you selected stuff.
Now:
👉 The canvas is clutter-free.
👉 AI Vision is merged into the AI Command Bar (AI Input / Prompt Bar).
How it works now
1. Select one or more objects OR an area on the AI canvas.
2. The AI Command Bar shows a thumbnail of the selected object/area.
3. Type your prompt in natural language as usual:
👉 “Summarize this customer journey and highlight 3 friction points”
👉 “Convert this flow into a RACI view”
👉 “Turn this sketch into a go-to-market funnel with stages and KPIs” - sky is the limit.
4. Use the AI Command Bar like you always do - choose AI models, layouts, web search, etc.
Behind the scenes, because there’s a thumbnail, the system knows:
👉 “Run this as AI Vision on the selected content.”
To exit AI Vision:
Click the ❌ on the thumbnail, or
Click on an empty area of the workspace.
Why this is a big deal
👉For business consultants & decision makers: No more mental branching between “AI for canvas” vs “AI for text.”
👉It’s one prompt surface. The context (thumbnail) decides how AI behaves.
👉Easier to train teams and students: When in doubt, use the AI bar. If something is selected, it acts on it.
👉Cleaner canvas in workshops, lectures, and live decision sessions.
3. AI Flowcharts with Connector Labels: Logic You Can Actually Read
We’ve upgraded AI Flowcharts to include connector labeling:
➡️ When generated with AI, connectors:
- Come with labels where appropriate.
- All labels are editable.
➡️ When you build diagrams manually:
- Double-click any connector to add or edit a label.
- Labels behave as text objects:
-- Font controls
-- Color
-- Size
-- Etc.
Why this matters in strategic work
A flowchart without labeled connectors is basically vibes.
Now you can explicitly show:
👉 Triggers
👉 Conditions
👉 Ownership
👉 Decision criteria
👉 Constraints & dependencies
In practice:
➡️ Show which condition sends a customer to “retain” vs “churn win-back.”
➡️ Explain which signal graduates a lead from “MQL” to “SQL.”
➡️ Make scenario branches explicitly labeled, not implied.
For online MBA-style teaching and client workshops, labeled connectors are huge for:
➡️ Teaching decision trees, process flows, and governance
➡️ Reducing “Wait, why does this go there?” questions
➡️ Making screenshots & exports self-explanatory even without you in the room
4. Bulk Styling for Animated Connectors
We recently introduced connector animations when using dotted or dashed lines, turning static diagrams into living flows.
Now, we’ve added bulk styling:
👉 Select multiple connectors at once.
👉 Apply:
- Line style
- Color
- Thickness
- Animation settings
All selected connectors update together.
This is perfect for:
➡️ Highlighting one active path through a complex system.
➡️ Showing multiple feedback loops or risk propagation paths.
➡️ Preparing diagrams for video walkthroughs or GIF exports without editing each connector one by one.

5. Download Animated Connectors as GIFs
Strategy doesn’t always live in tools like Jeda.ai. It also has to show up in:
- Slide decks
- LMS content
- Second brain pages & Internal wikis
- Investor updates
Now you can:
Download animated connectors with objects as GIFs.
Use cases:
👉 Drop a looping GIF of a system or funnel into a slide instead of a static box diagram.
👉 Give students a visual memory hook for complex flows.
👉 Help execs “get it” in 3 seconds on a slide rather than reading 3 paragraphs.
6. Snap to Guide Off by Default: Freedom First, Grid Later
We’ve turned Snap to Guide OFF by default.
Why:
- Early-stage thinking is messy.
- For strategy, experimentation, and live facilitation, rigid snapping often slows the mind.
You can still:
Turn Snap & Guide back ON in Workspace Settings when you’re in “production layout” mode.
Net effect:
- Brainstorming = fluid.
- Polishing = precise.
You choose when to be pixel-perfect.
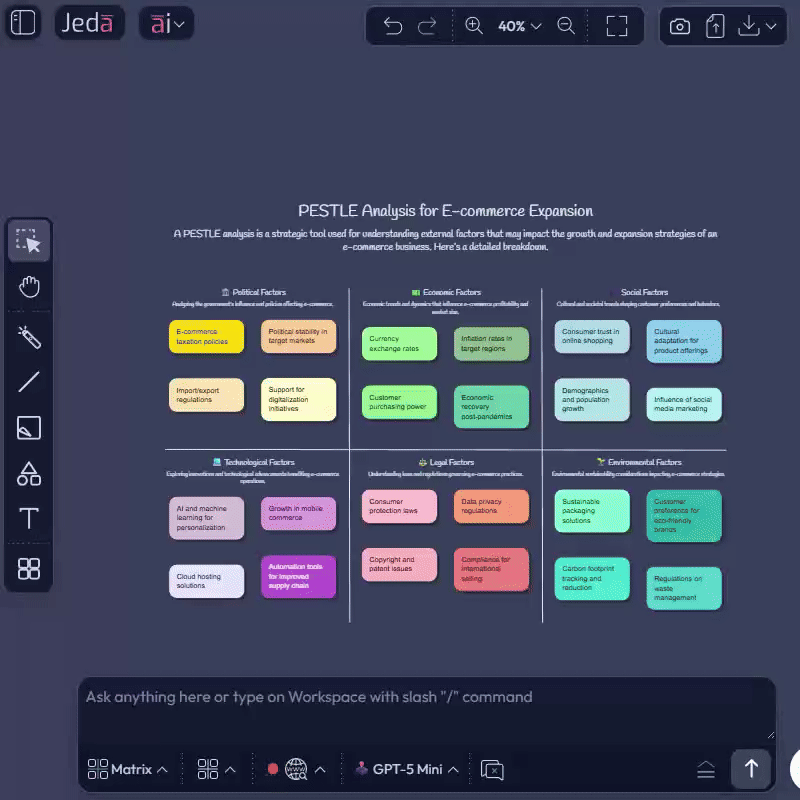
7. “Analysis” → “Matrix” (Same Power, Better Name)
We’ve renamed the “Analysis” command to “Matrix.”
➡️ No functionality changed.
➡️ The name now better reflects what it’s commonly used for:
- 2x2s
- Comparison matrices
- Trade-off grids
- Prioritization matrices, etc.
This is a clarity move for new users and cohort students:
When they see “Matrix,” they know it’s where structured comparison and framing happens.
8. Bug Fixes & Performance Improvements
Under the hood, we’ve shipped:
👉 Performance optimizations for smoother canvas interactions.
👉 UI & UX tweaks for more predictable behavior.
👉 Bug fixes that clean up edge-case weirdness.
The result:
👉 More stable client sessions
👉 A platform you can rely on for serious work, not just play
What This Release Really Means for Consultants & Decision Makers
If you strip away the UI talk, this release gives you:
➡️ A floating command center (new toolbar) that makes drawing, annotating, and guiding discussions feel natural.
➡️ A unified AI surface (command bar + AI Vision) that reduces cognitive overhead and speeds up training for teams and cohorts.
➡️ Diagrams that explain themselves (connector labels, animations, GIF exports).
➡️ A canvas that respects how strategy is actually developed: messy first, polished later.
Jeda.ai is a place where:
🫵 You think
🫵 You show
🫵 You convince
All in one place.
Wrapping Up
If you’re running an online MBA program, EMBA course, or advisory practice, this update is built to make your boards, sessions, and explanations punch way above their weight.
Go play with the left toolbar, try a Matrix command, label your connectors, and export a GIF of a system in motion.
Your stakeholders shouldn’t just read strategy.
They should see it move.

