
Manual Case Analysis
Reading a 50-page case study, highlighting key passages, manually creating a SWOT matrix in PowerPoint. Takes 6–8 hours per case.
Hours of manual case analysis while classmates present sharper work
Reading a 50-page case study, highlighting key passages, manually creating a SWOT matrix in PowerPoint. Takes 6–8 hours per case.
Searching multiple sources for competitor data, building comparison spreadsheets, manually drawing positioning maps. Takes 4–6 hours per analysis.
Drawing business model canvas sections across slides. Rebuilding for every strategy shift takes hours.
Manually extracting data to spreadsheets, creating pivot tables and charts. Hours of Excel work before any analytical interpretation.
Reading industry reports, mapping industry structure in Visio, creating Porter's Five Forces in PowerPoint. Takes 1–2 days per strategy.
Team members build parts in separate files. Combining and formatting into one cohesive deliverable takes days of rework.
Precise analytical decisions — instant visual intelligence
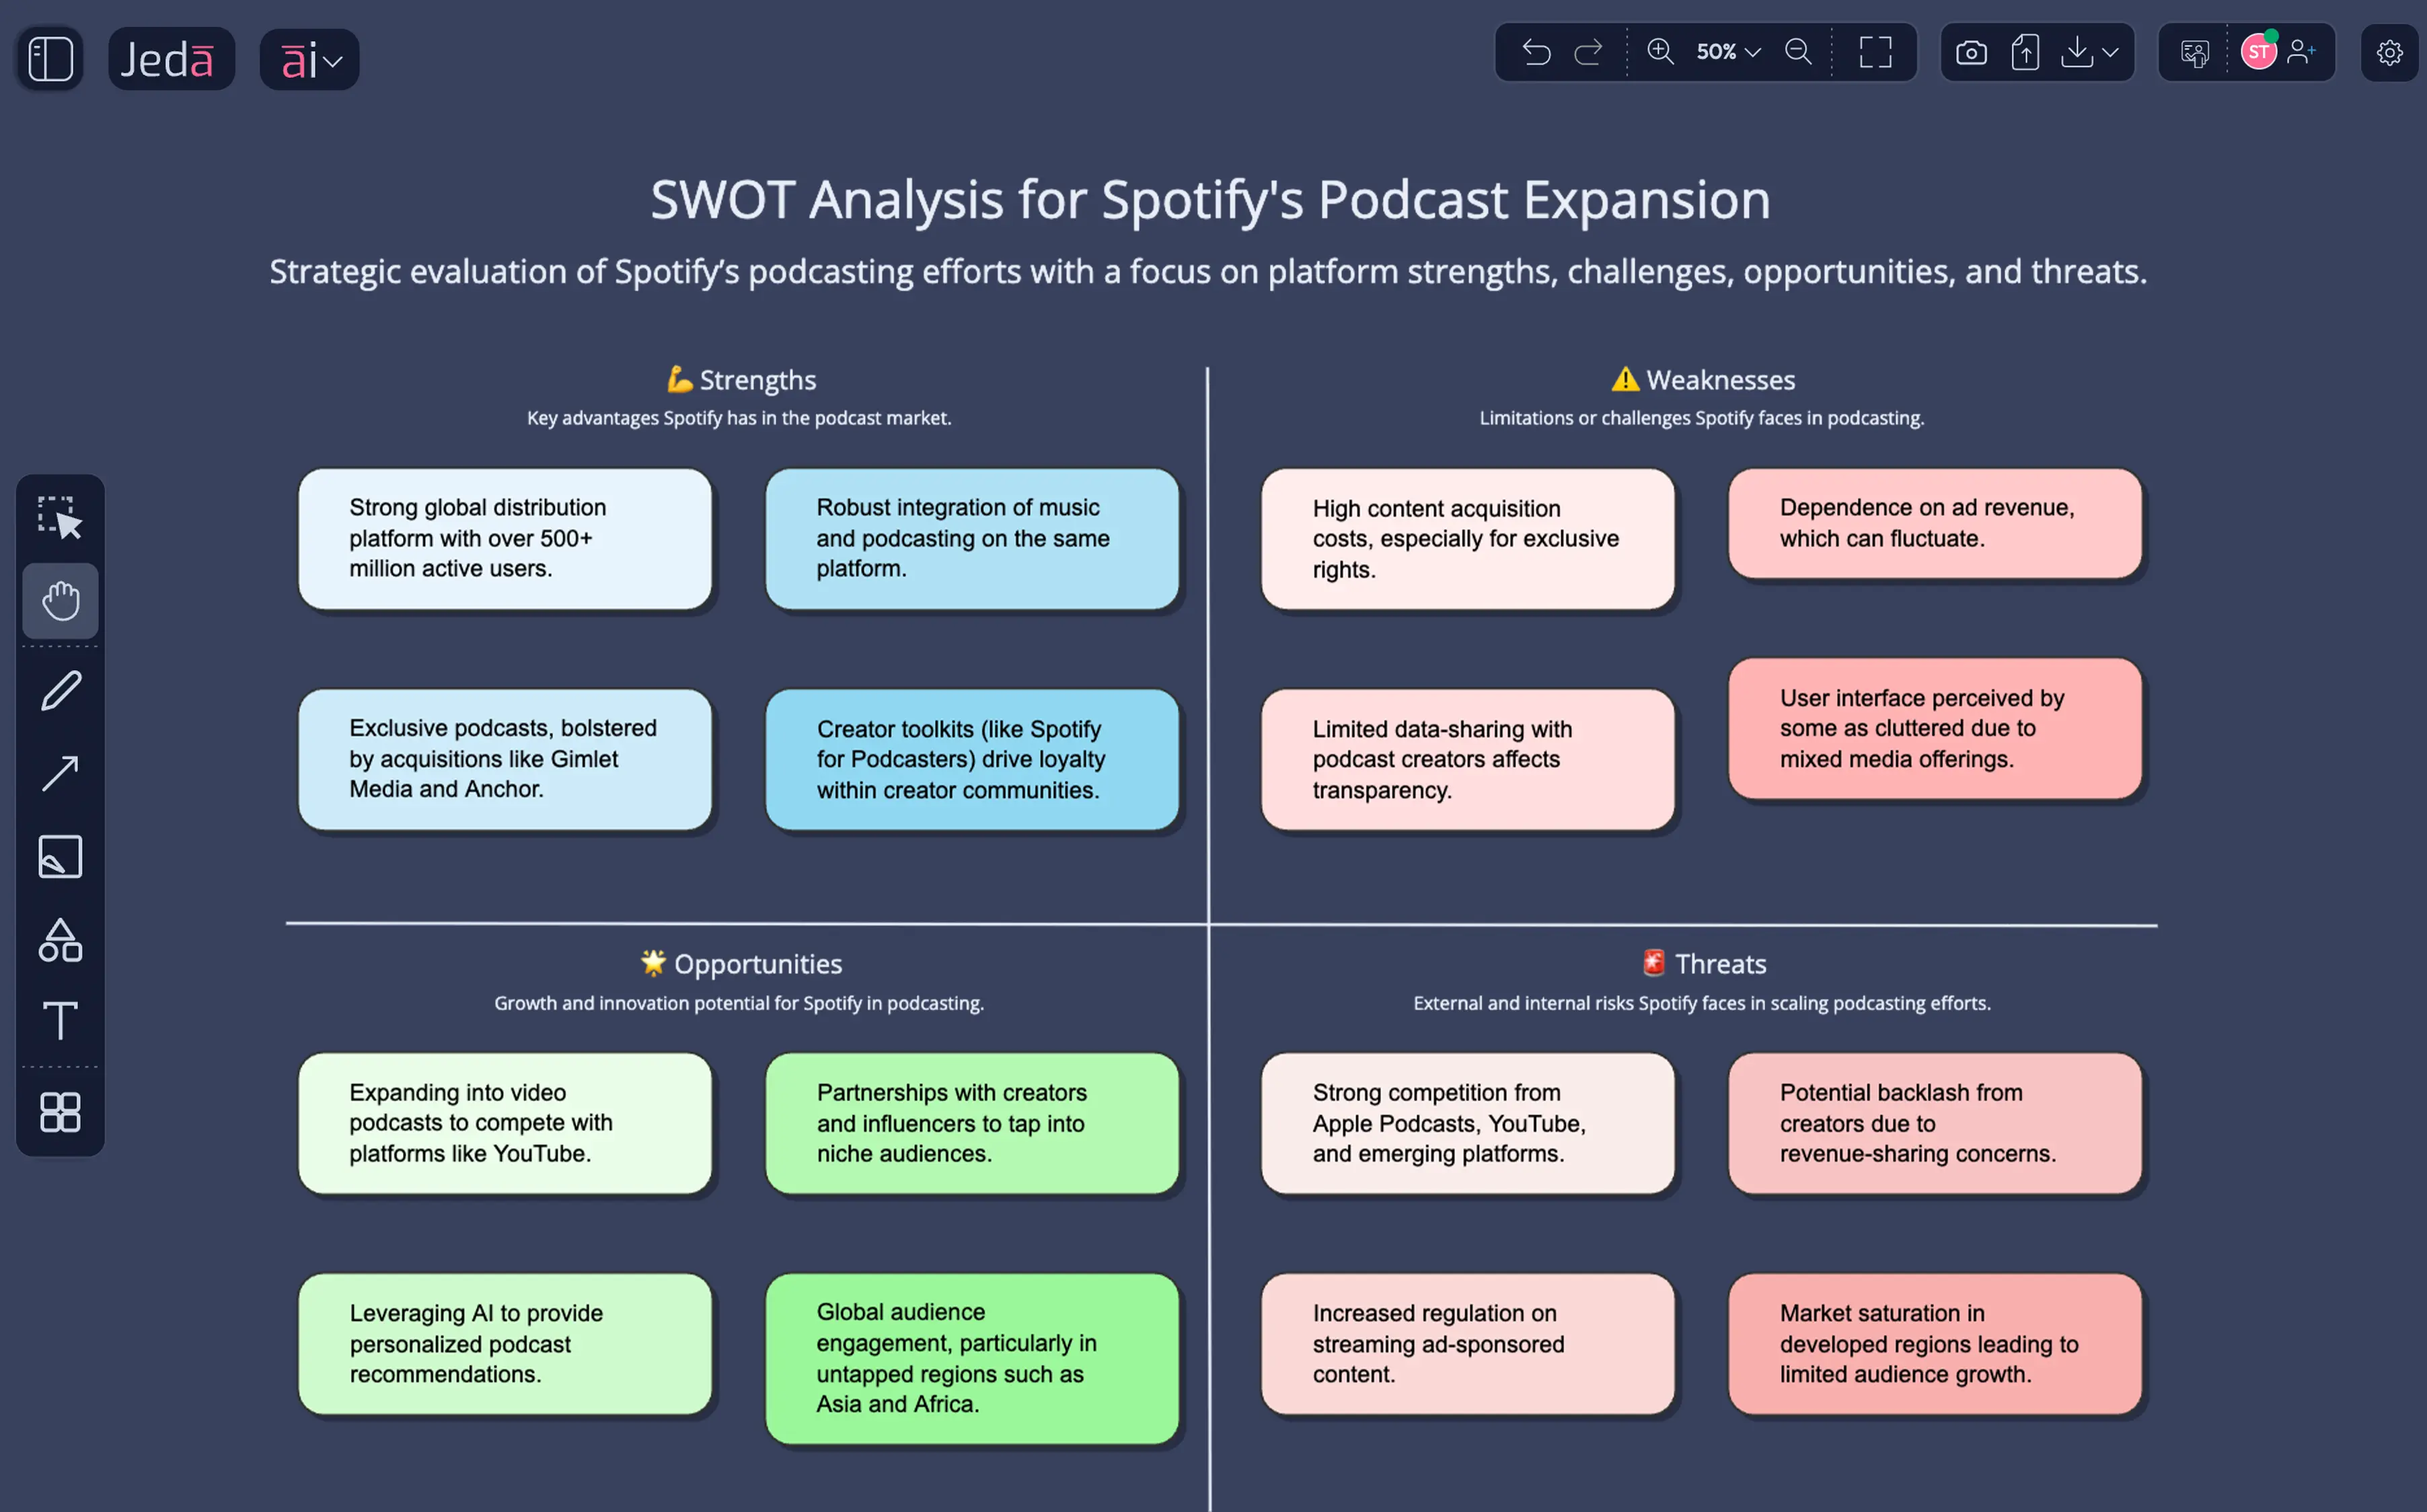
Upload case files via Document Insight. AI generates methodology-backed frameworks in 8 minutes. Your team edits, verifies logic, and keeps the thinking trace visible.
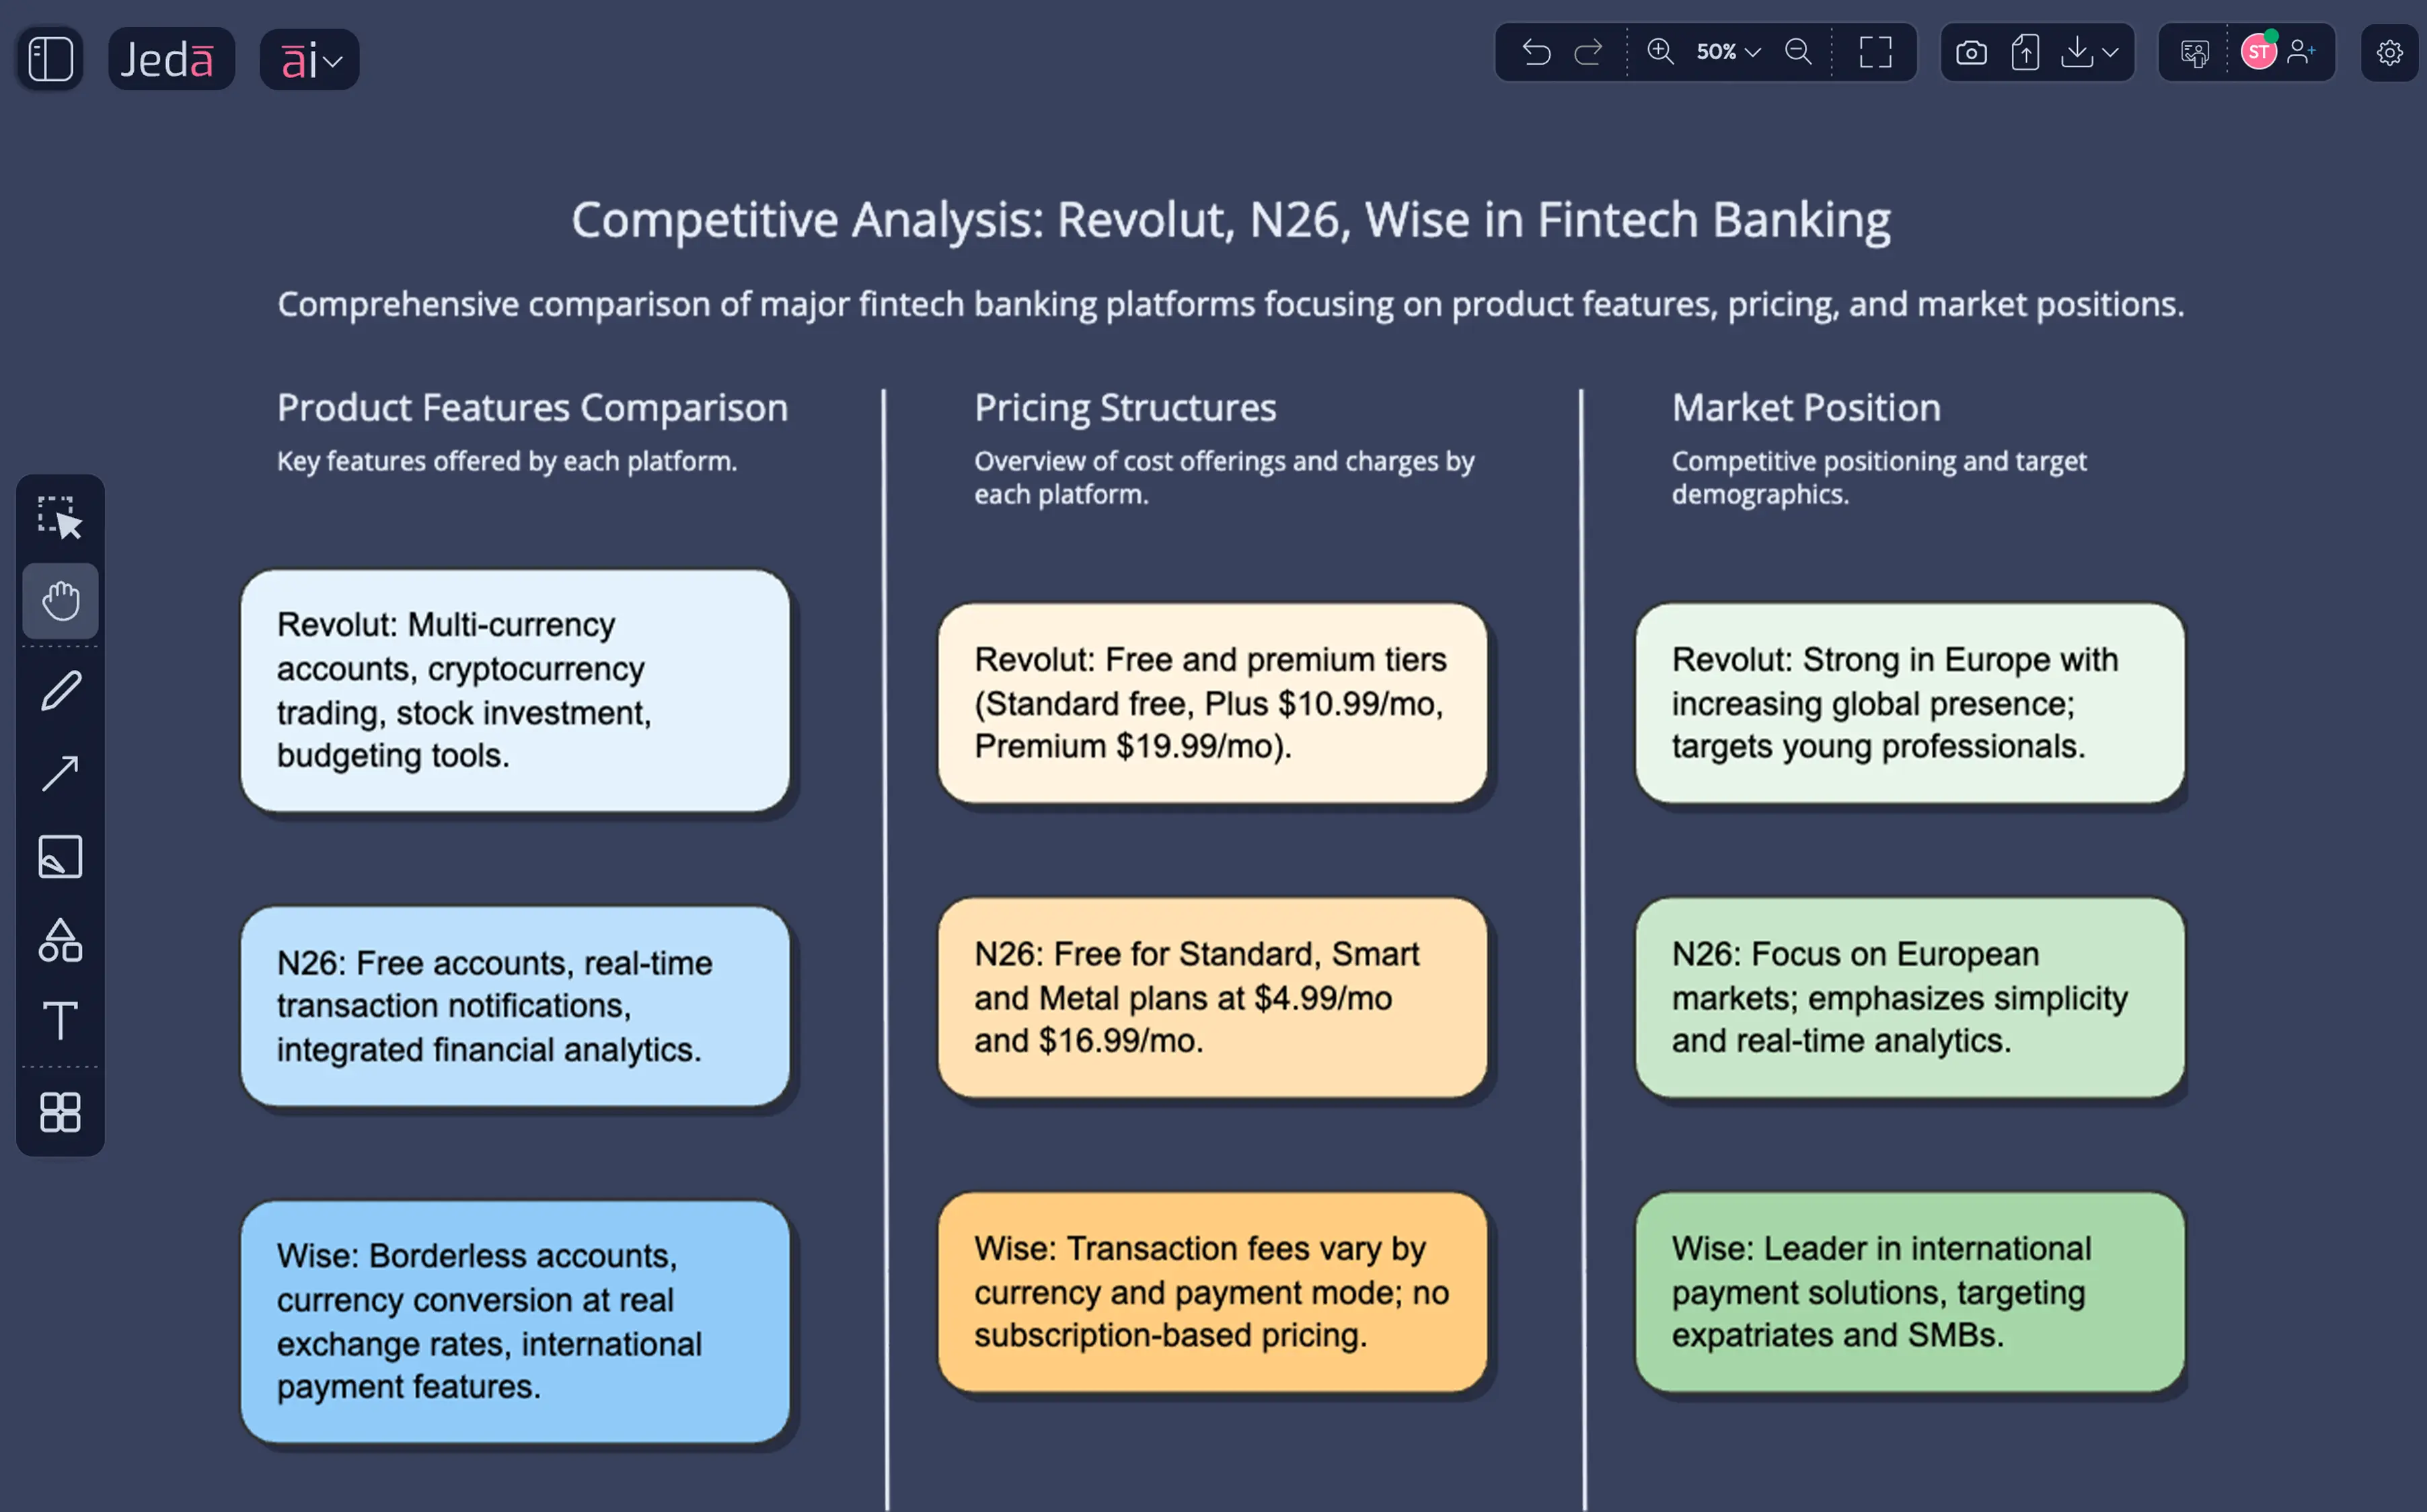
AI Matrix creates positioning grids in 4 minutes. Compare SWOT, Porter's Five Forces, and Value Chain on one canvas to expose alignment or contradictions.
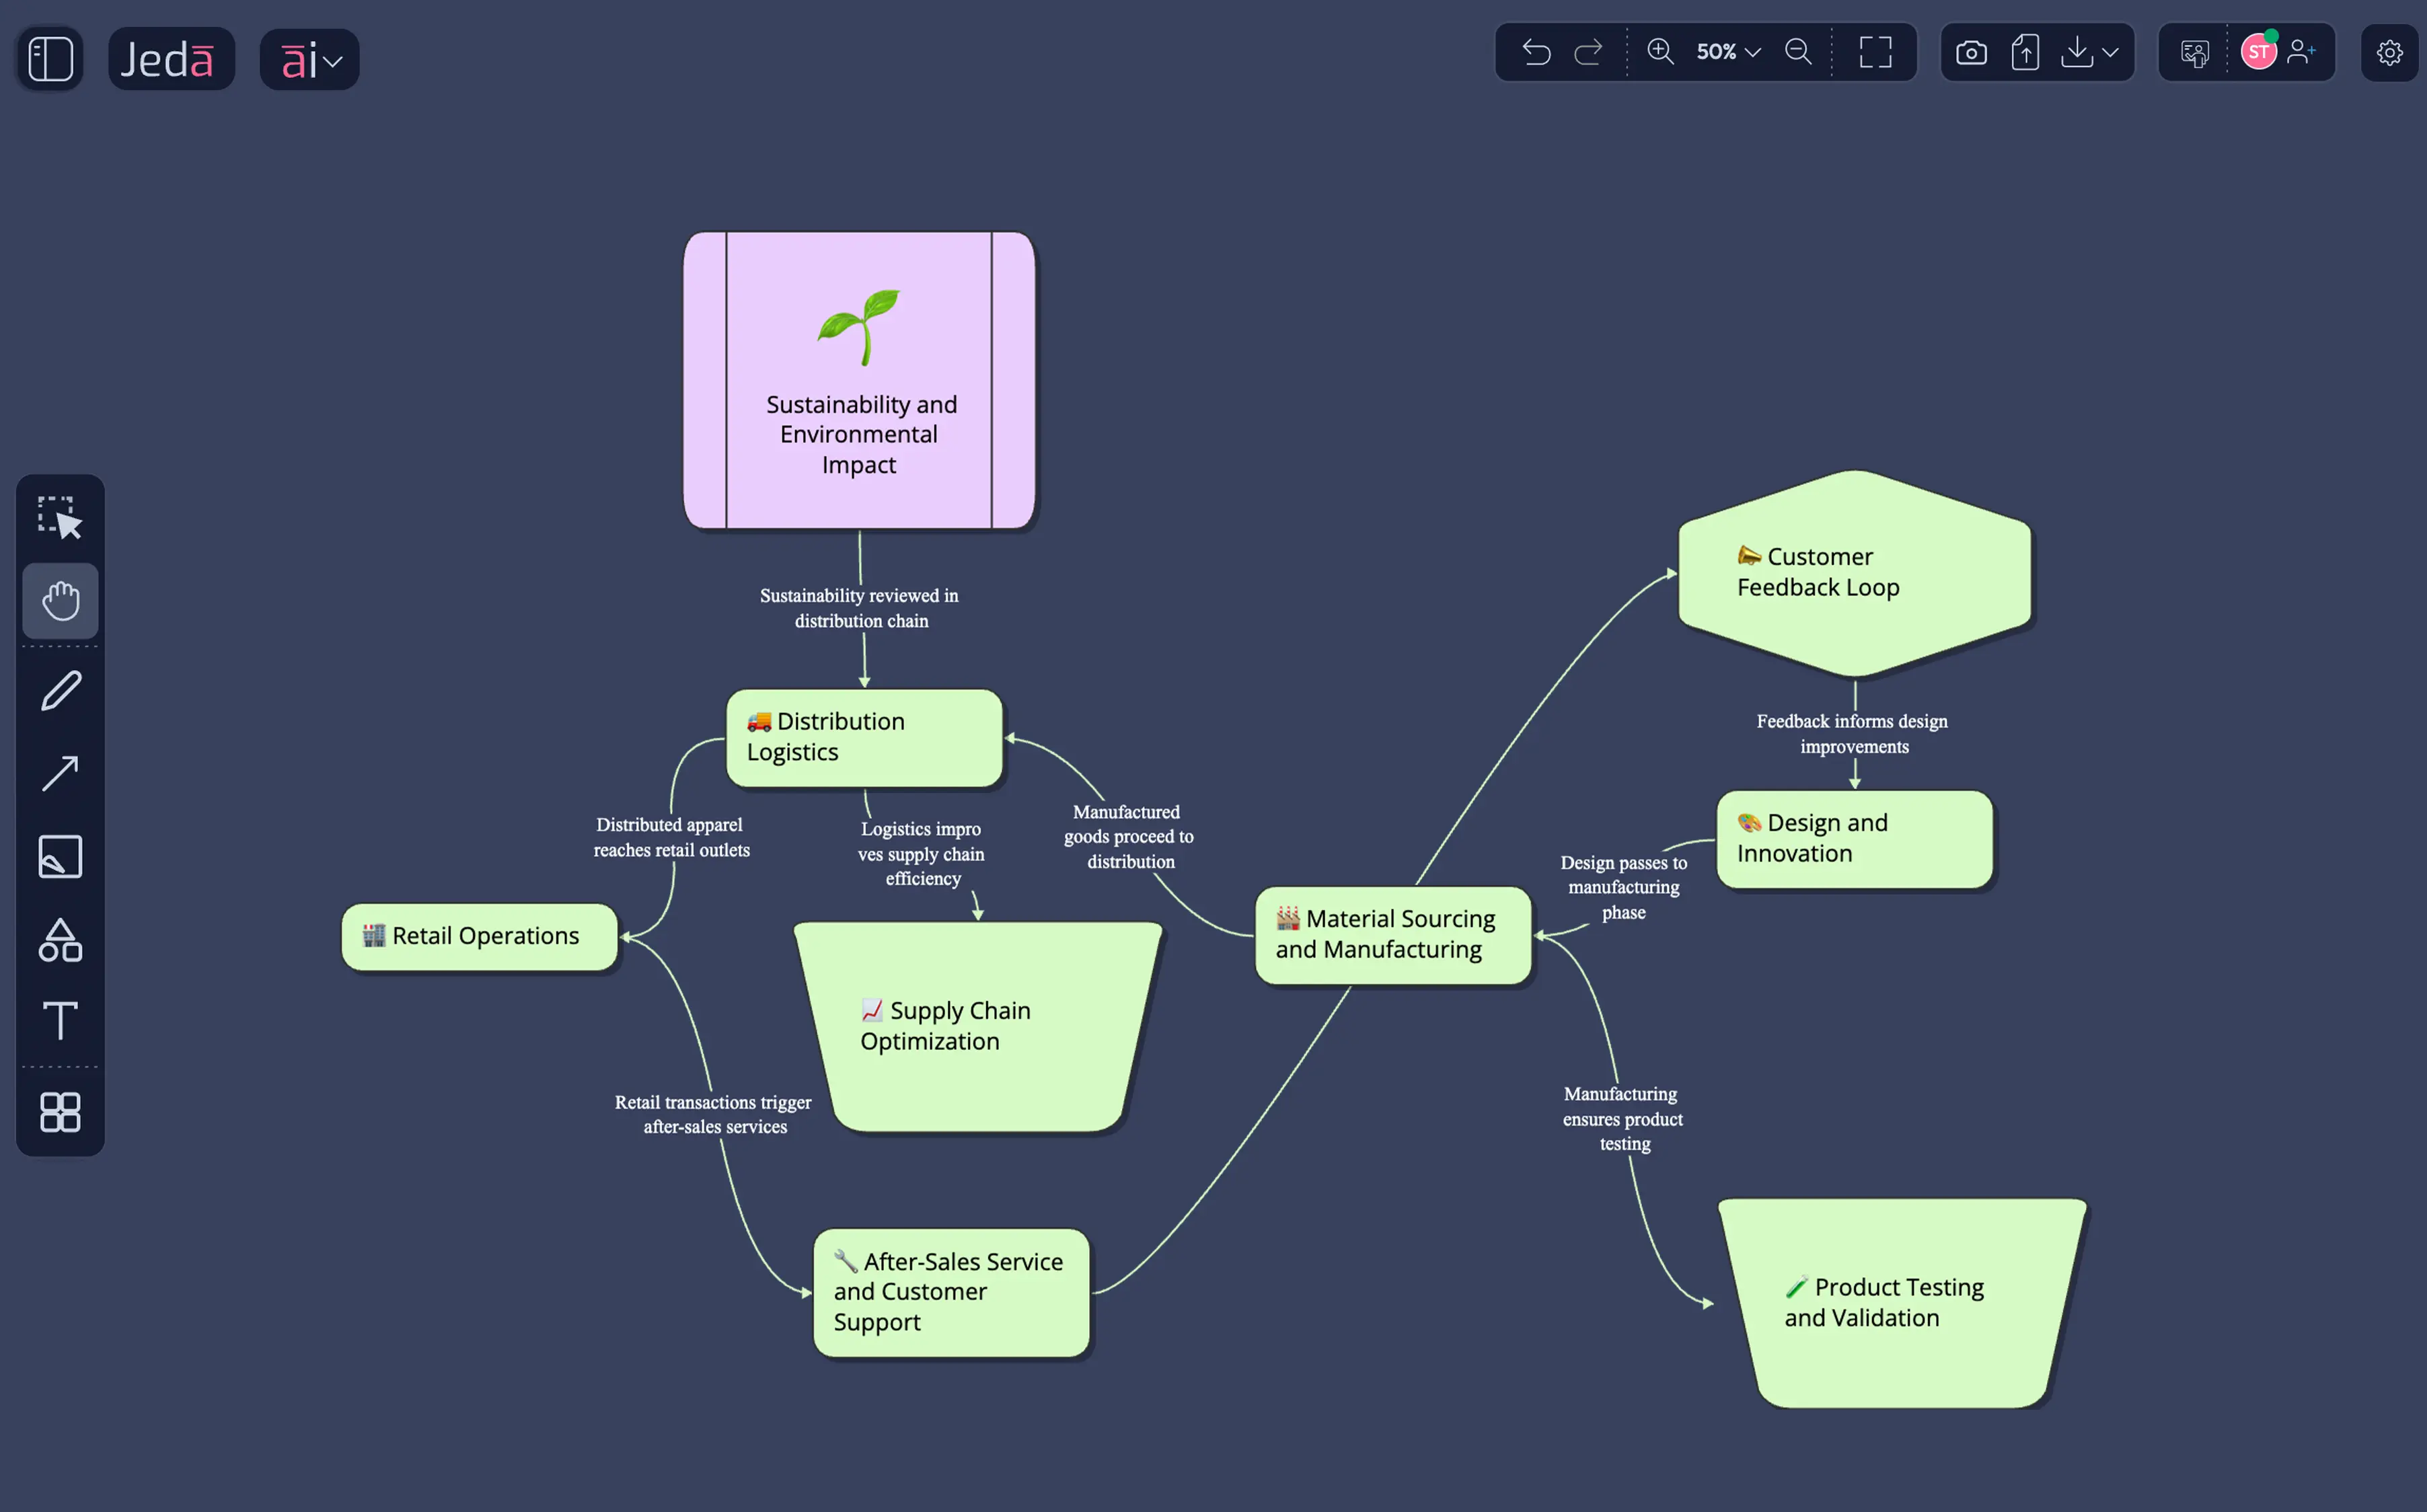
Describe the concept and AI Diagram generates a complete canvas in 3 minutes. Your team validates the model on a shared visual workspace.
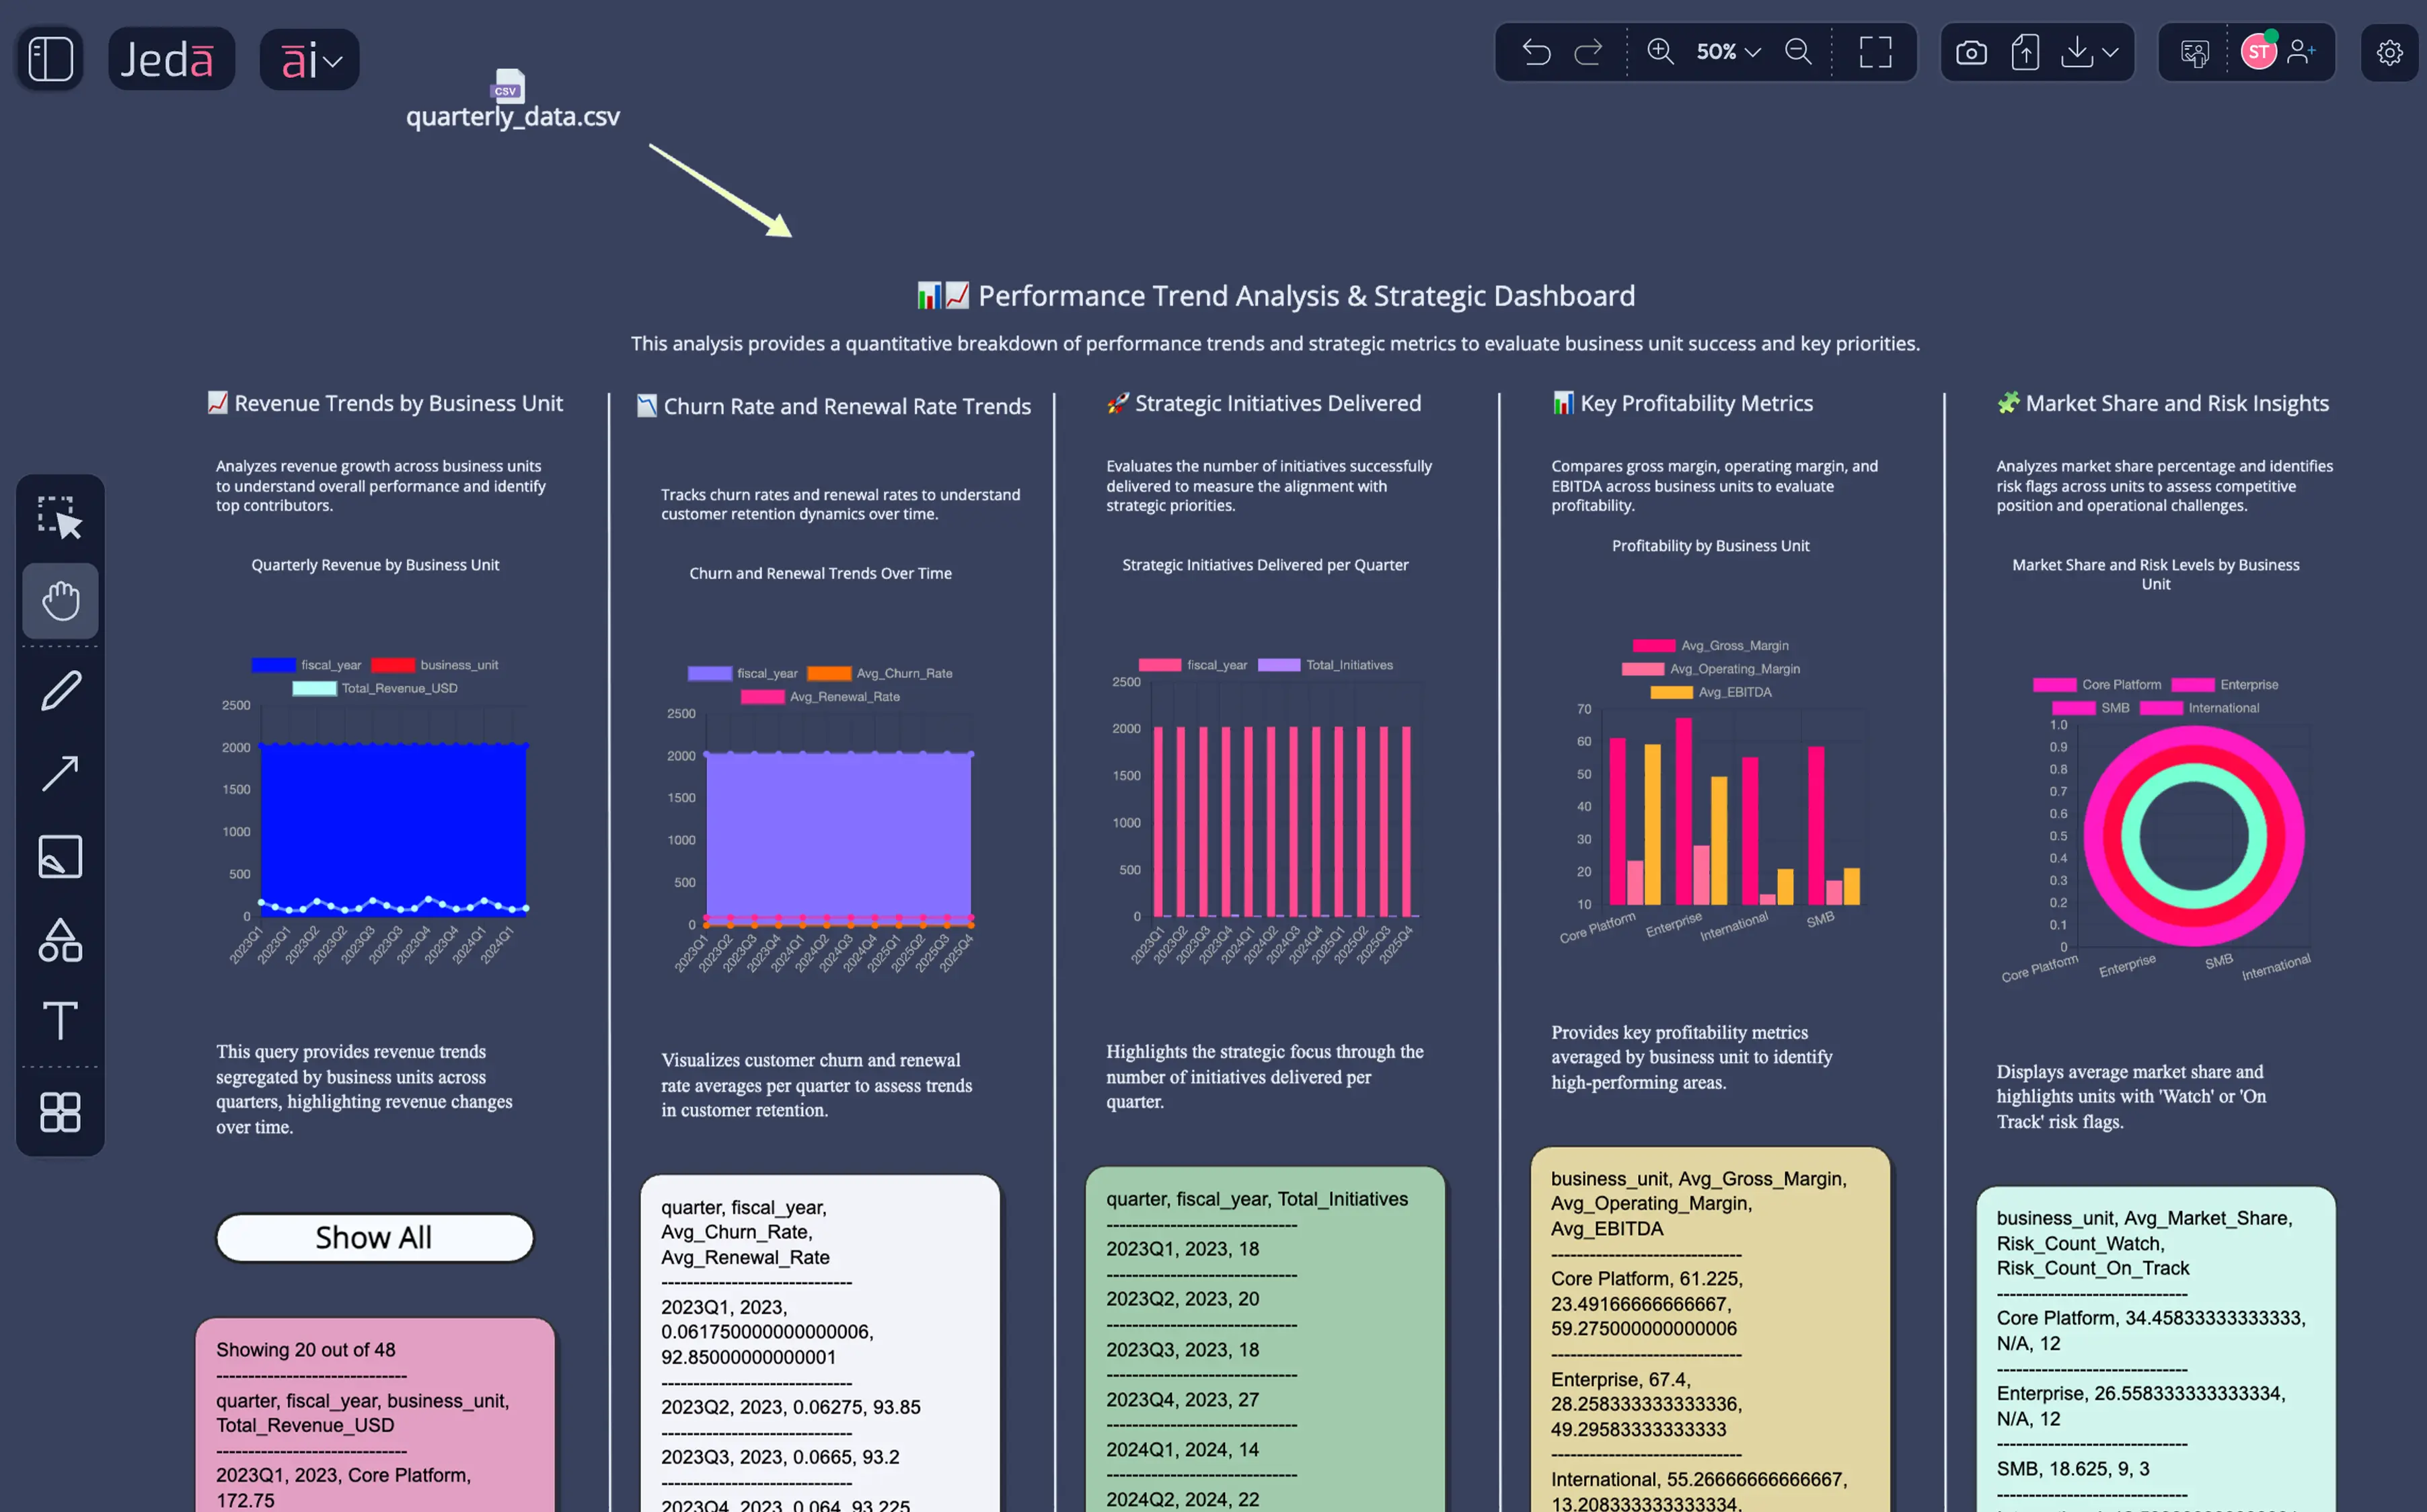
Upload CSVs via Data Insight. AI generates visual trend analysis in 5 minutes. Data becomes strategic matrices, not disconnected charts.
AI generates Porter's Five Forces in 6 minutes — proven strategy methodology, now visual, editable, and collaborative.
Study groups refine strategy together in real time. Teams annotate beside the analysis instead of chasing feedback across docs, slides, and chats.
Generate analytical frameworks encoding hundreds of years of business methodology. Build comparison grids populated with AI analysis your team validates on a shared canvas. Place multiple frameworks side by side to triangulate the same company, market, or strategic decision.
Build business model canvases and value chain maps — visual output your team comprehends faster than reading long-form case reports. Use it for operating models, market-entry logic, customer journeys, and capstone strategy narratives.
Map stakeholder influence and expand analytical option trees. Frameworks built on hundreds of years of analytical methodology, now visual and collaborative. Students stop seeing frameworks as isolated templates and start seeing how ideas branch, conflict, and converge.
Upload case study financials or market datasets. Jeda.ai transforms raw spreadsheets into visual analysis your team validates to reveal analytical insights. Turn market share, growth rates, financial ratios, and segment data into BCG matrices, trend maps, and evidence-backed strategy visuals.
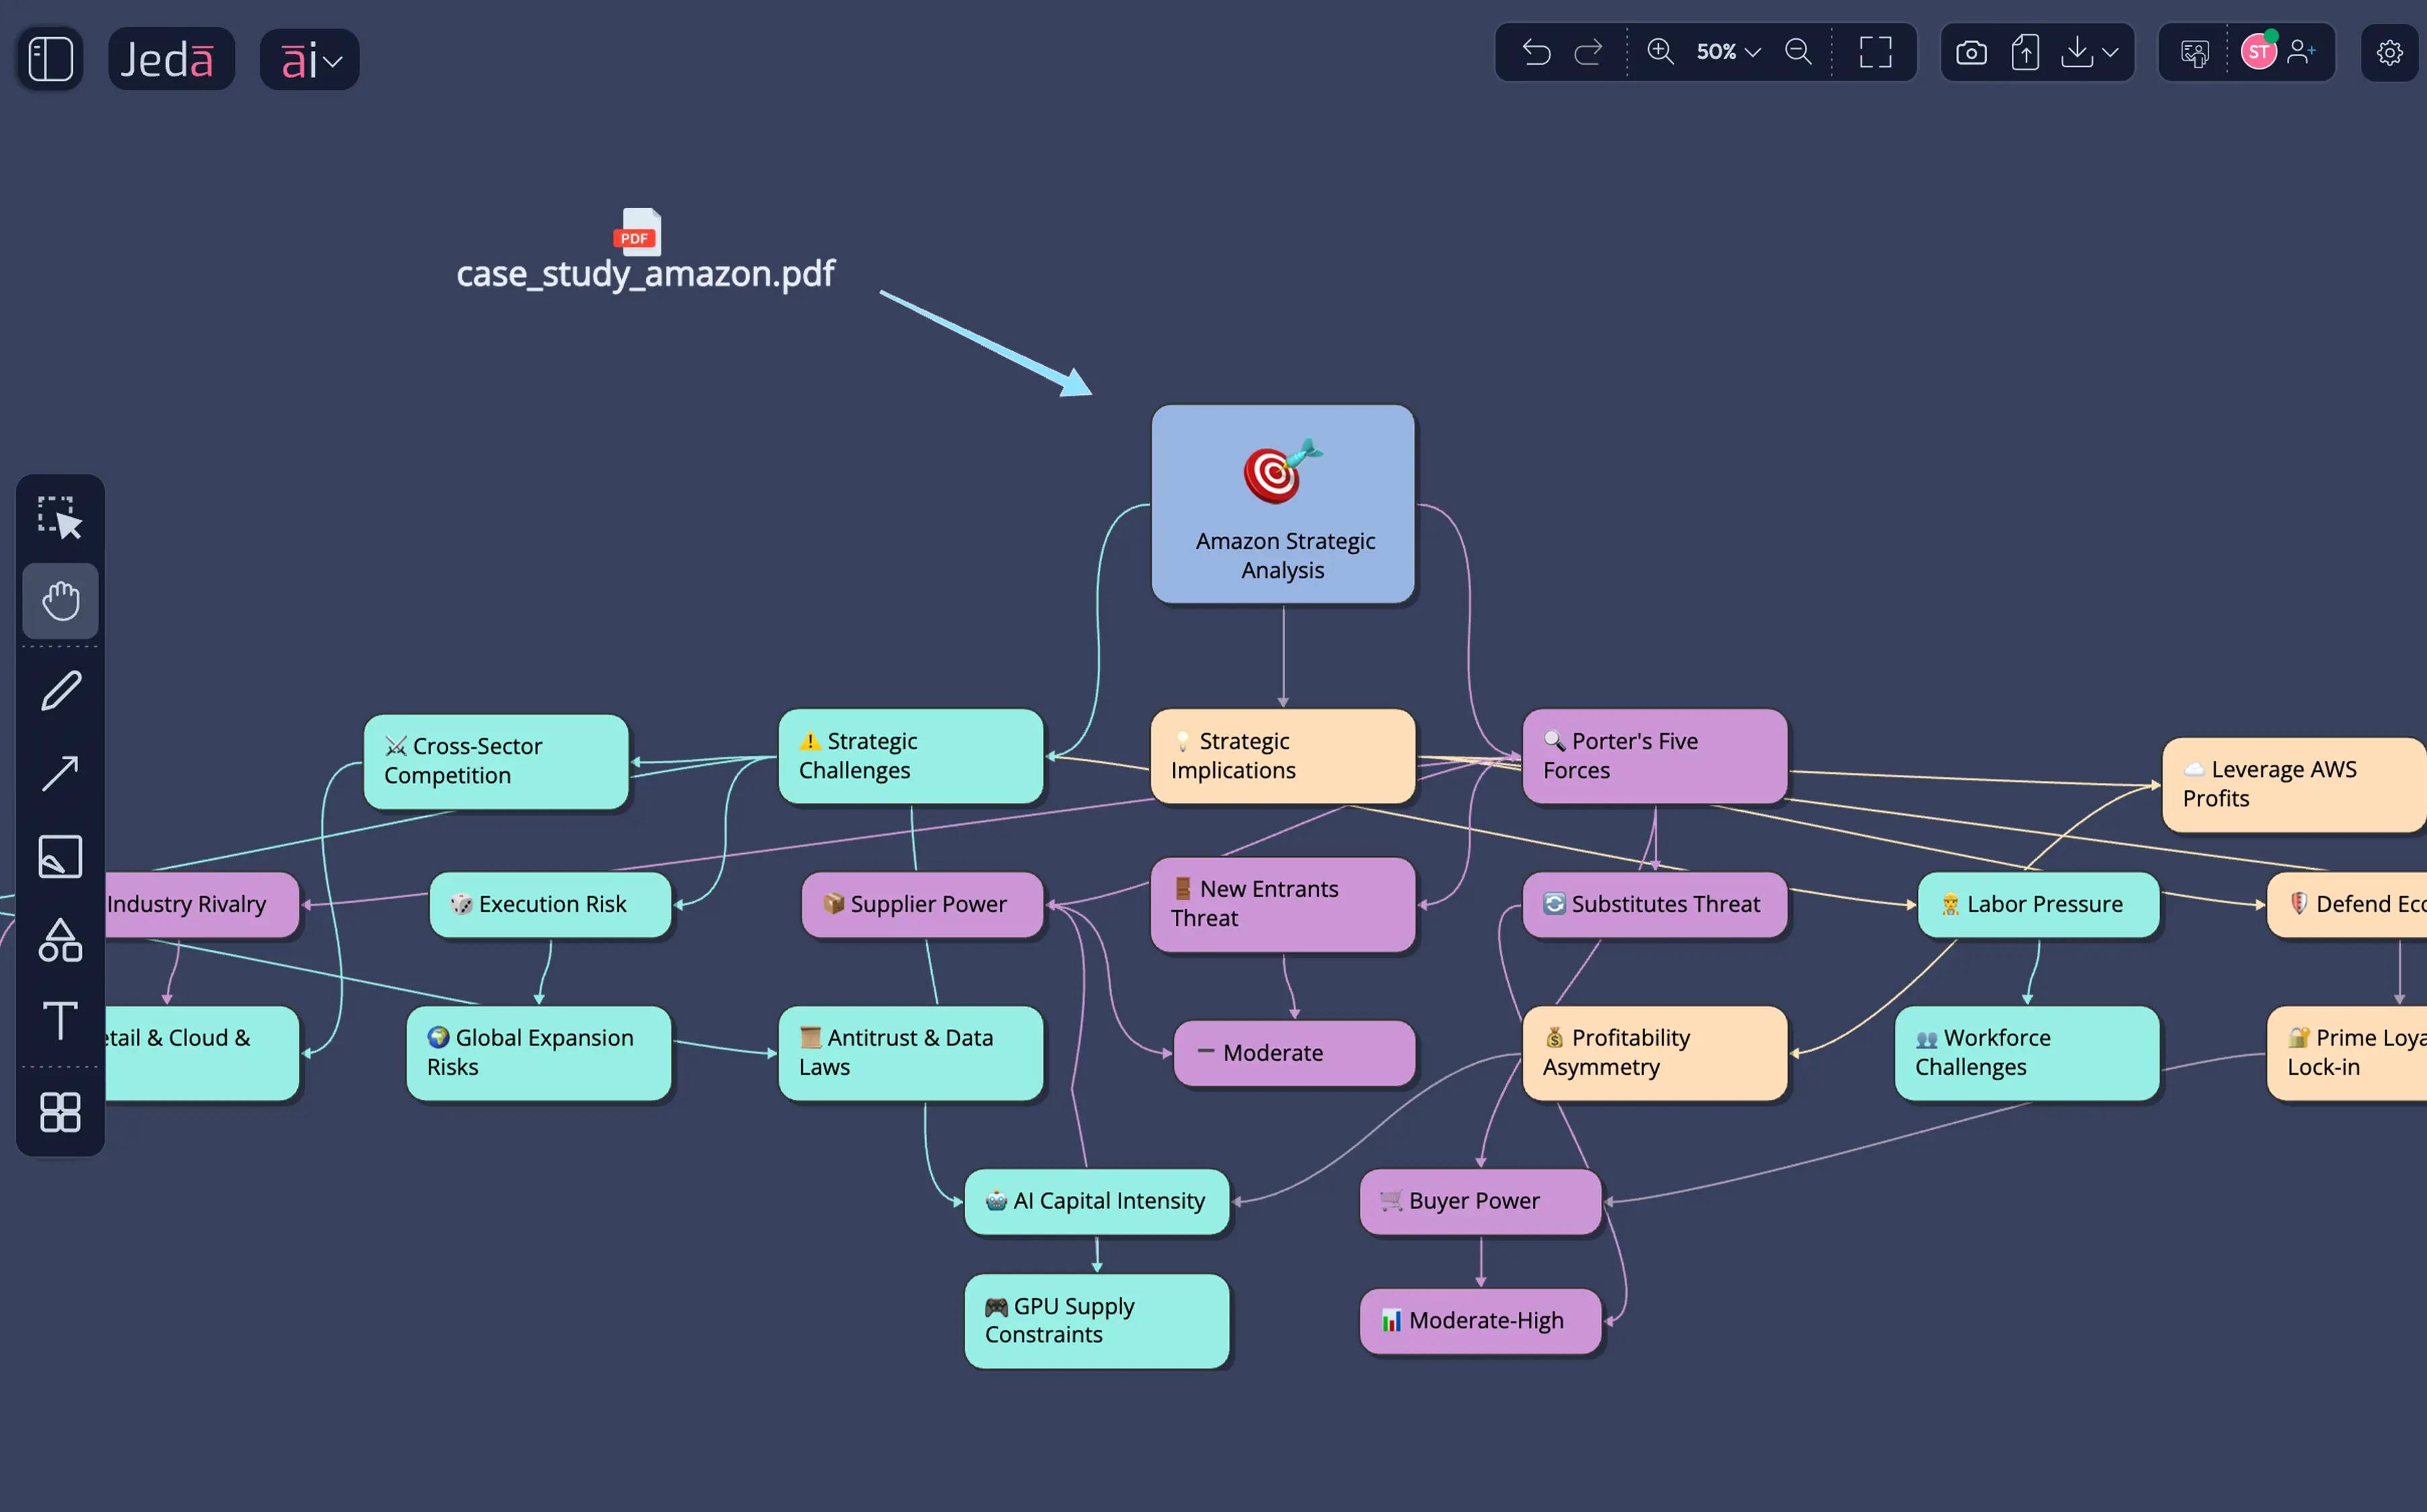
Feed dense case study PDFs into Document Insight. AI extracts context into visual frameworks built on decades of methodology, ready for project delivery. Use case PDFs, annual reports, 10-Ks, analyst notes, and strategic memos as source material for editable frameworks.
A full AI powerhouse — the most powerful language, reasoning, and image models packed together for every use case. Jeda.ai's Multi-LLM Agent runs multiple models simultaneously, picks the best output, and delivers smarter results than any single model alone.
Start by uploading case study PDFs or industry reports. Jeda.ai's AI understands the analytical context immediately, starting the thinking process WITH your team. Use Document Insight for cases, annual reports, 10-Ks, strategy decks, or executive briefs; use Data Insight when your analysis depends on CSV or Excel datasets.
Case studies & reports
Strategic descriptions
"Harvard_Business_School_Amazon_Case.pdf"
Choose the command purpose-built for your analysis. Multiple models compare reasoning so AI thinks WITH you — presenting the best analytical analysis, not dictating one answer. Pick Matrix for SWOT, PESTEL, BCG, and comparison grids; Diagram for Business Model Canvas and Value Chain; Mindmap for stakeholder maps and option trees; Data Insight and Document Insight when your evidence lives in files.
Structured frameworks
Process & structure
Not a blank template. A framework built on hundreds of years of analytical methodology — populated with AI analysis your team reviews visually. Seconds, not hours. Run the same strategy question across multiple models, inspect where the reasoning agrees or diverges, and treat consensus as a signal to validate — not a shortcut to blindly accept.
Best of breed reasoning
MBA-grade analysis
• Brand Equity
• Logistics Network
• Content Costs
• Thin Margins
• Cloud Growth
• Global Expansion
• Regulation
• Competition
AI generated the framework. Your team sees it, challenges it, and refines it with real-time web search data. That's thinking WITH, not FOR. Market context, competitor moves, regulatory signals, and industry updates become part of the same visual analysis instead of a separate browser-tab scavenger hunt.
Always current
Competitive intelligence
All analytical frameworks live on one shared Jeda.ai canvas. Your group aligns in one session because the brain processes visual frameworks faster than text reports. Each table, study group, or project team can work in its own canvas region, compare outputs with other groups, and keep instructor feedback beside the work it critiques.
Real-time sync
Gap analysis
Visual deliverables your team processes faster than reading a text briefing. Export as PNG, SVG, or PDF and update your presentation deck in seconds. Because the canvas is already the working artifact, teams spend less time reformatting chat output and more time defending the strategic recommendation.
Presentation ready
PNG, SVG, PDF
AI should think WITH you, not generate FOR you. Run strategy prompts through GPT, Claude, Grok, and 18 AI models. The Aggregator surfaces the strongest analytical path, while students compare patterns, disagreements, and consensus before quoting results in recommendations.
Ground every AI output in current market data, not stale training context. Real-time web search pulls competitor moves, product launches, and market news into visual frameworks, keeping strategy work current when case material is outdated or incomplete.
Analytical frameworks built over hundreds of years deserve iteration. Analyze cases, capstone scenarios, and executive education exercises without workflow walls. Run, challenge, revise, and compare frameworks until the team understands the decision — not just the first answer.
Convert any analytical visual into another format: SWOT to Porter's Five Forces, mind map to roadmap, sticky notes to flowchart. Reframe the same strategy through a different lens without rebuilding the deliverable from scratch.
Generate visual strategy matrices your team can review faster than long-form case reports. Compare internal constraints with external market signals on one shared surface.
Create AI-populated industry structure analysis for class discussion, capstone defense, or client presentation. Use it beside SWOT, PESTEL, and Value Chain to pressure-test recommendations.
Map business ecosystems visually and identify gaps, assumptions, and model risks quickly. Ideal for capstone ventures, innovation projects, and market-entry scenarios.
Refine market positioning on a shared canvas, with AI as a strategic thinking partner. Map alternatives, trade-offs, and defensible points of differentiation.
Create visual value chain diagrams that reveal advantage, bottlenecks, dependencies, and trade-offs. Connect operational realities to strategic recommendations.
AI generates the first structured view. Your team challenges, edits, and refines it for class presentations. The canvas preserves the thinking path, not just the final artifact.
Encoding hundreds of years of analytical methodology into instant visual frameworks. Generate SWOT, PESTEL, BCG, competitive matrices, prioritization grids, and decision tables your team can edit together.
Visual output your brain processes faster than text reports. Map value chains, business models, operating models, and strategic relationships. Use diagrams when the logic depends on dependencies, flows, or cause-and-effect structure.
AI thinks WITH you by pulling the latest market signals directly into your frameworks. Useful for competitor moves, regulatory updates, market shifts, and current evidence that static cases may not include.
Your team validates one analysis and transforms it into multiple deliverables. Turn a mind map into a matrix, a matrix into an infographic, or sticky notes into a flowchart without rebuilding from scratch.
Study groups, instructors, and teams align in one workspace. Color-coded contribution, shared chat history, annotations, and live collaboration make the thinking visible to everyone.
Deepen any node with AI reasoning. Expand a weak assumption, missing risk, competitor threat, or recommendation branch while preserving the structure of the original framework.
Strategy heritage at your fingertips. From Ansoff to Blue Ocean, Business Model Canvas to Value Chain, the methodology is built into the workflow instead of buried in templates.
Visual output faster than reading dense cases. Drop in case PDFs, reports, or 10-Ks and turn extraction into editable strategy frameworks your team can verify and refine.
| Feature | Jeda.aiAI-First | ChatGPT | Canva | Miro | PowerPoint | Notion AI |
|---|---|---|---|---|---|---|
| AI Business Frameworks | Prompt → SWOT, BCG, BMC visuals | Limited | Limited | Limited | ||
| Dynamic Prompt | AI thinks WITH you | |||||
| Multi-LLM Agent | 18 AI Models + Aggregator | |||||
| Unlimited AI Content | Unlimited | Limited | Limited | Limited | Paid add-on | Limited |
| Document to Visuals | Case PDFs → visual analysis | Limited | Limited | |||
| Data Insight | Financial CSVs → analysis charts | Limited | ||||
| 300+ MBA Frameworks | SWOT, Ansoff, Kano + 300 more | Limited | Limited | Limited | Limited | |
| Vision Transform | Any format to any format | |||||
| Real-Time Collaboration | Multi-user Canvas + AI Chat | Limited | ||||
| Pricing | Free / $10/user/mo | $20/mo | Free / $15/mo | Free / $10/user/mo + Limited AI Credit | $22/user/mo (M365) | $10/user/mo |
Comparison based on publicly available information as of March 2026.
From 6–8 hours to under 15 minutes per case study. Frameworks built over hundreds of years, now AI-populated in seconds. Teams begin with a structured draft, then use their judgment to refine it.
Stakeholders comprehend the full picture simultaneously — relationships, gaps, and priorities visible at a glance in visual frameworks. Cross-framework comparison makes contradictions easier to spot before the final presentation.
AI thinks WITH your team to cover more cases. Visual deliverables reduce project review cycles because comprehension is instant. Cohorts can compare more scenarios without drowning in text summaries.
Teams align in one session, not three, because Jeda.ai delivers visual output your team processes faster than text briefs. The canvas becomes both the working surface and the presentation foundation.